NZD/JPY TECHNICAL ANALYSIS
The New Zealand Dollar might have experienced a false downside breakout against the Japanese Yen. After NZD/JPY closed under rising support from the middle of May, prices bounced off the 61.8% Fibonacci retracement at 68.18. Now the pair is testing the 69.68 – 70.03 inflection range and an upside push could shift the focus back in early June highs (71.24 – 71.73). The long term picture may still remain bearish however should falling resistance from 2014 hold - red line on the daily chart below.
NZD/JPY - DAILY CHART

Chart Created Using TradingView
NZD/CAD TECHNICAL ANALYSIS
The New Zealand Dollar may turn lower versus the Canadian Dollar as NZD/CAD tests December highs (0.8780 – 0.8800). That is because there is the presence of RSI divergence, a sign of fading upside momentum. This can at times precede a turn lower, which would place the focus on the 0.8712 – 0.8738 inflection point. Further descending from there may then open the door to testing rising support from the March bottom. Otherwise, further gains exposes July 2019 highs (0.8865 – 0.8890) towards 2016 falling resistance.
NZD/CAD - DAILY CHART

Chart Created Using TradingView
NZD/CHF TECHNICAL ANALYSIS
The New Zealand Dollar recently turned lower against the Swiss Franc following the emergence of a bearish Evening Star candlestick pattern – see daily chart below. Downside Follow-through in NZD/CHF has been somewhat lackluster after a bounce off 0.6043. A push above 0.6164 – the August 2019 low – may open the door to testing the 0.6272 – 0.6330 resistance range. This area also closely aligns with a falling trend line from 2019. Resuming losses entails closing under rising support from the March bottom.
NZD/CHF - DAILY CHART
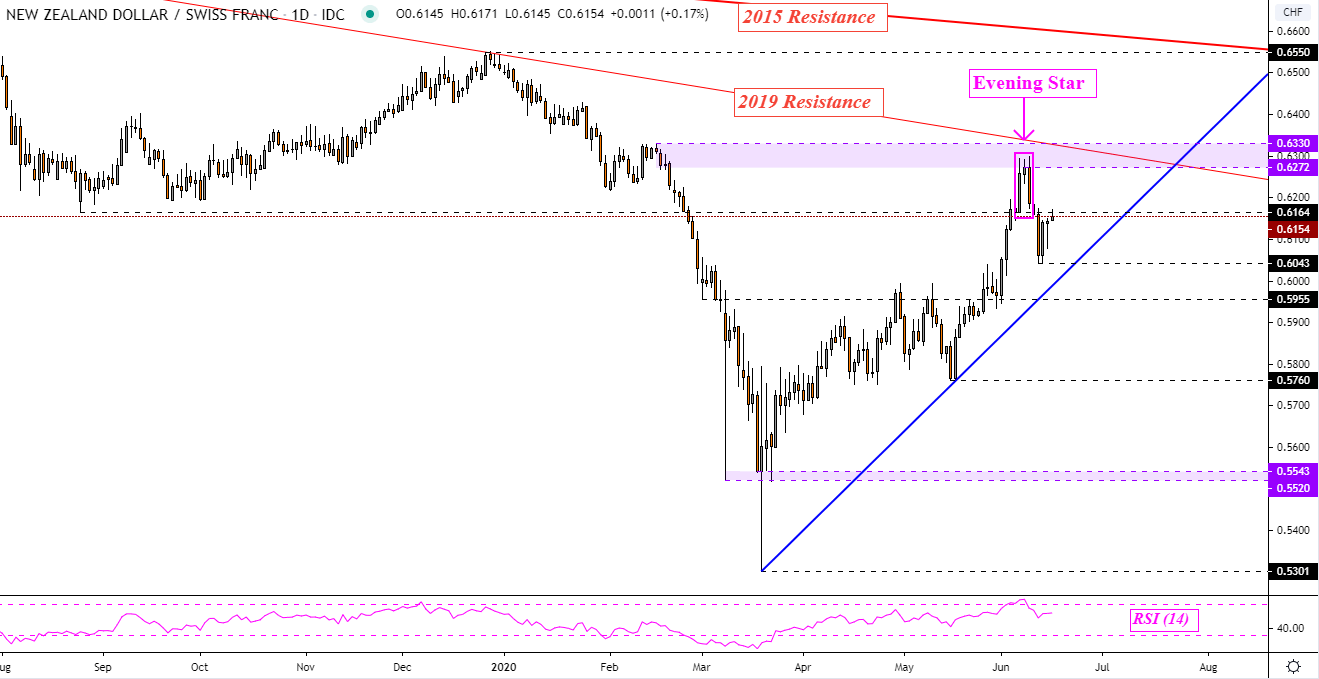
Chart Created Using TradingView
Reprinted from Dailyfx,the copyright all reserved by the original author.
風險提示:本文所述僅代表作者個人觀點,不代表 Followme 的官方立場。Followme 不對內容的準確性、完整性或可靠性作出任何保證,對於基於該內容所採取的任何行為,不承擔任何責任,除非另有書面明確說明。

暫無評論,立馬搶沙發