· 閱讀量 692
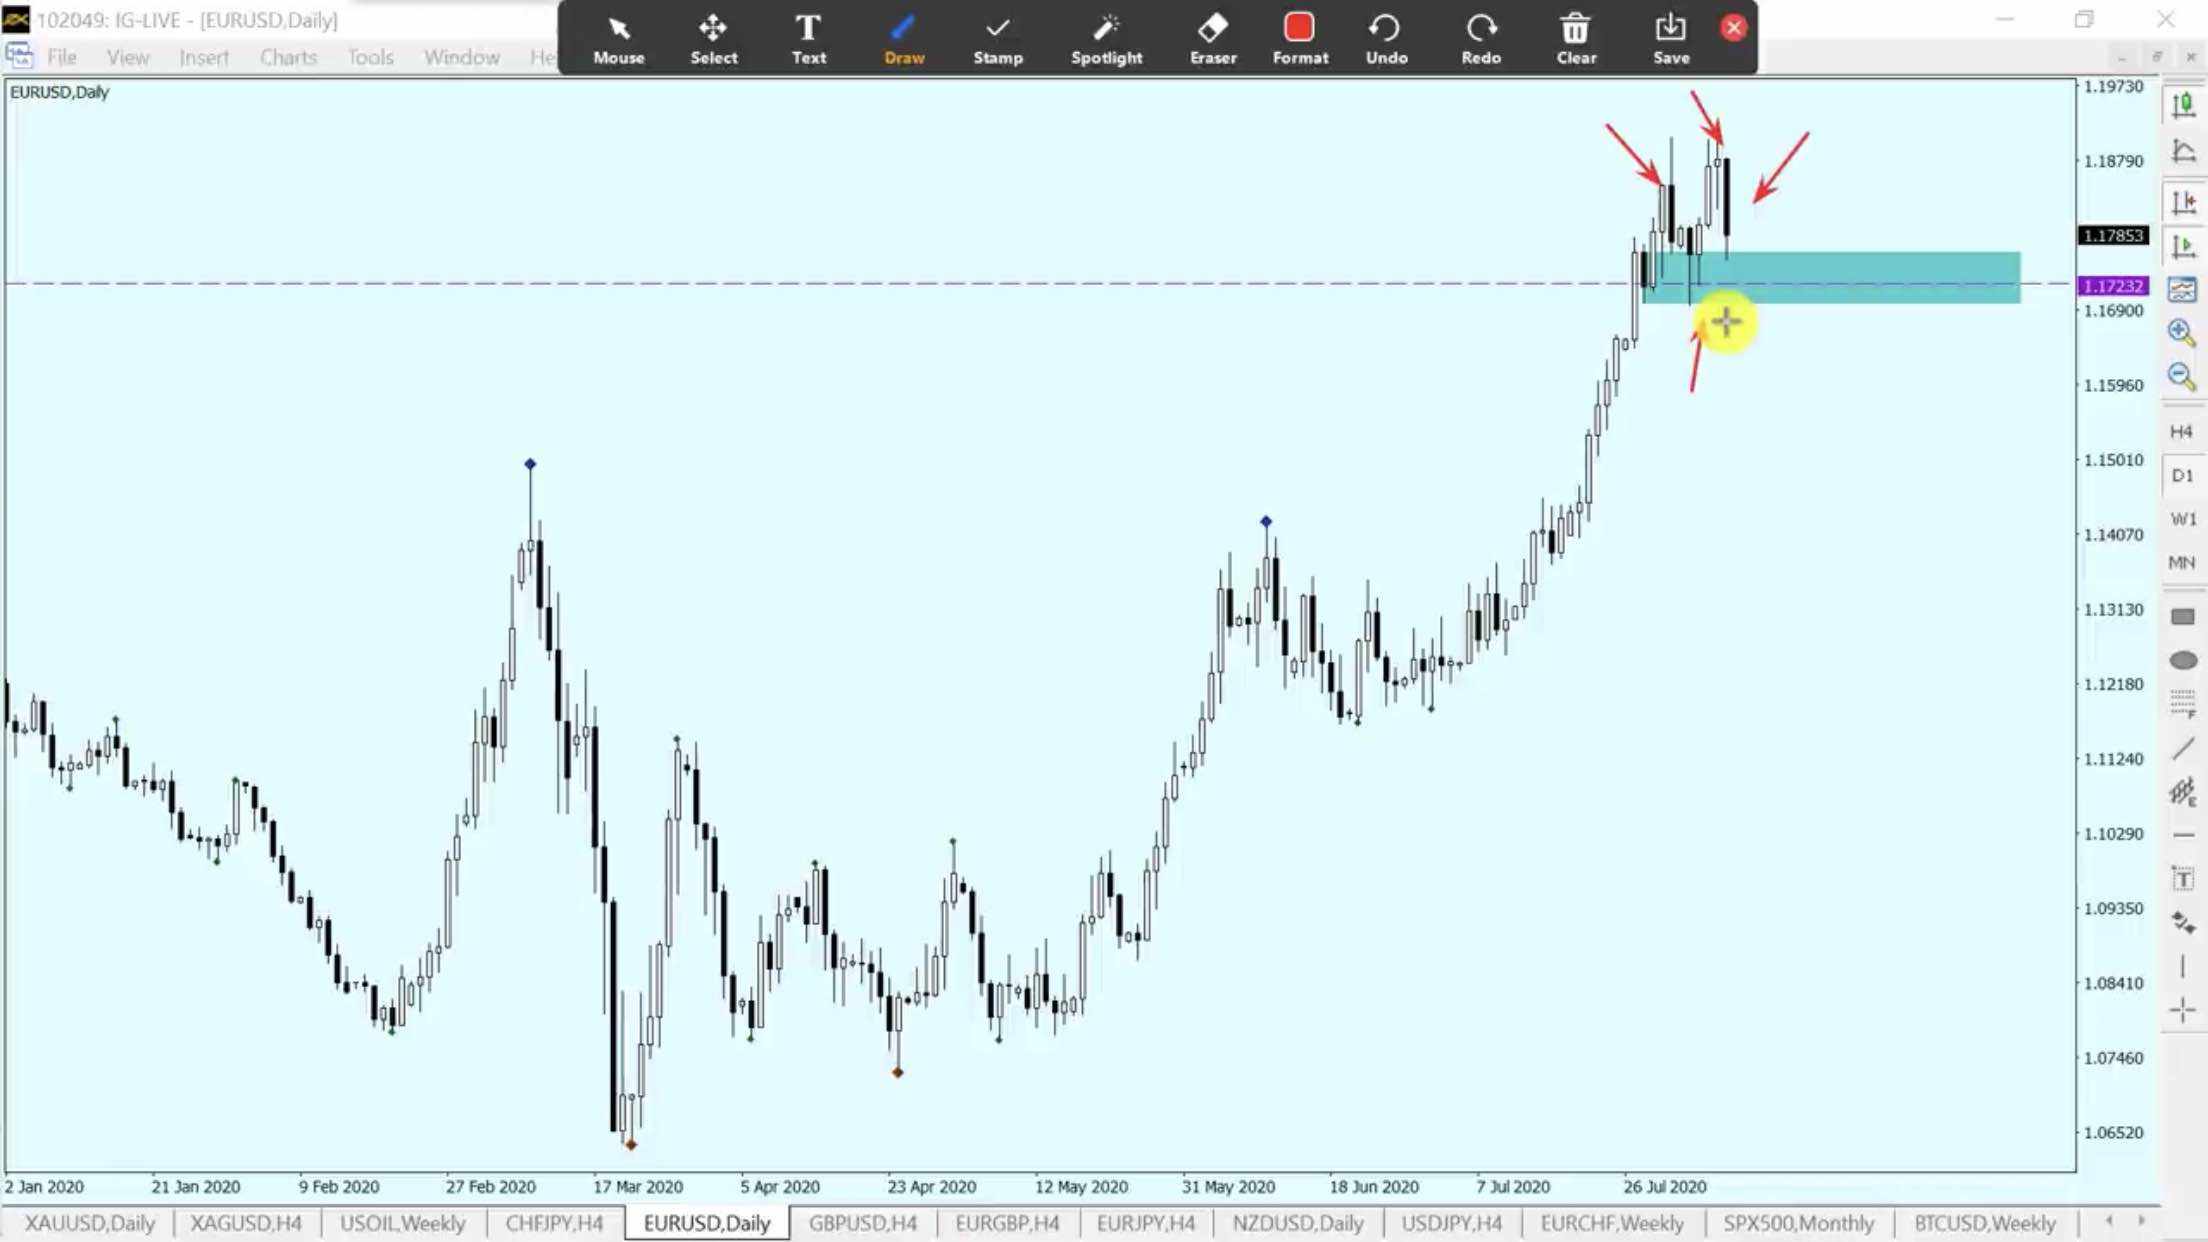
On the daily chart, we can the Selling candles but dont be traped by the market, it's just a re-test candle after a long wave up. There 2 pin bars up we can see on the D1 chart here, that means we can BUY from there.
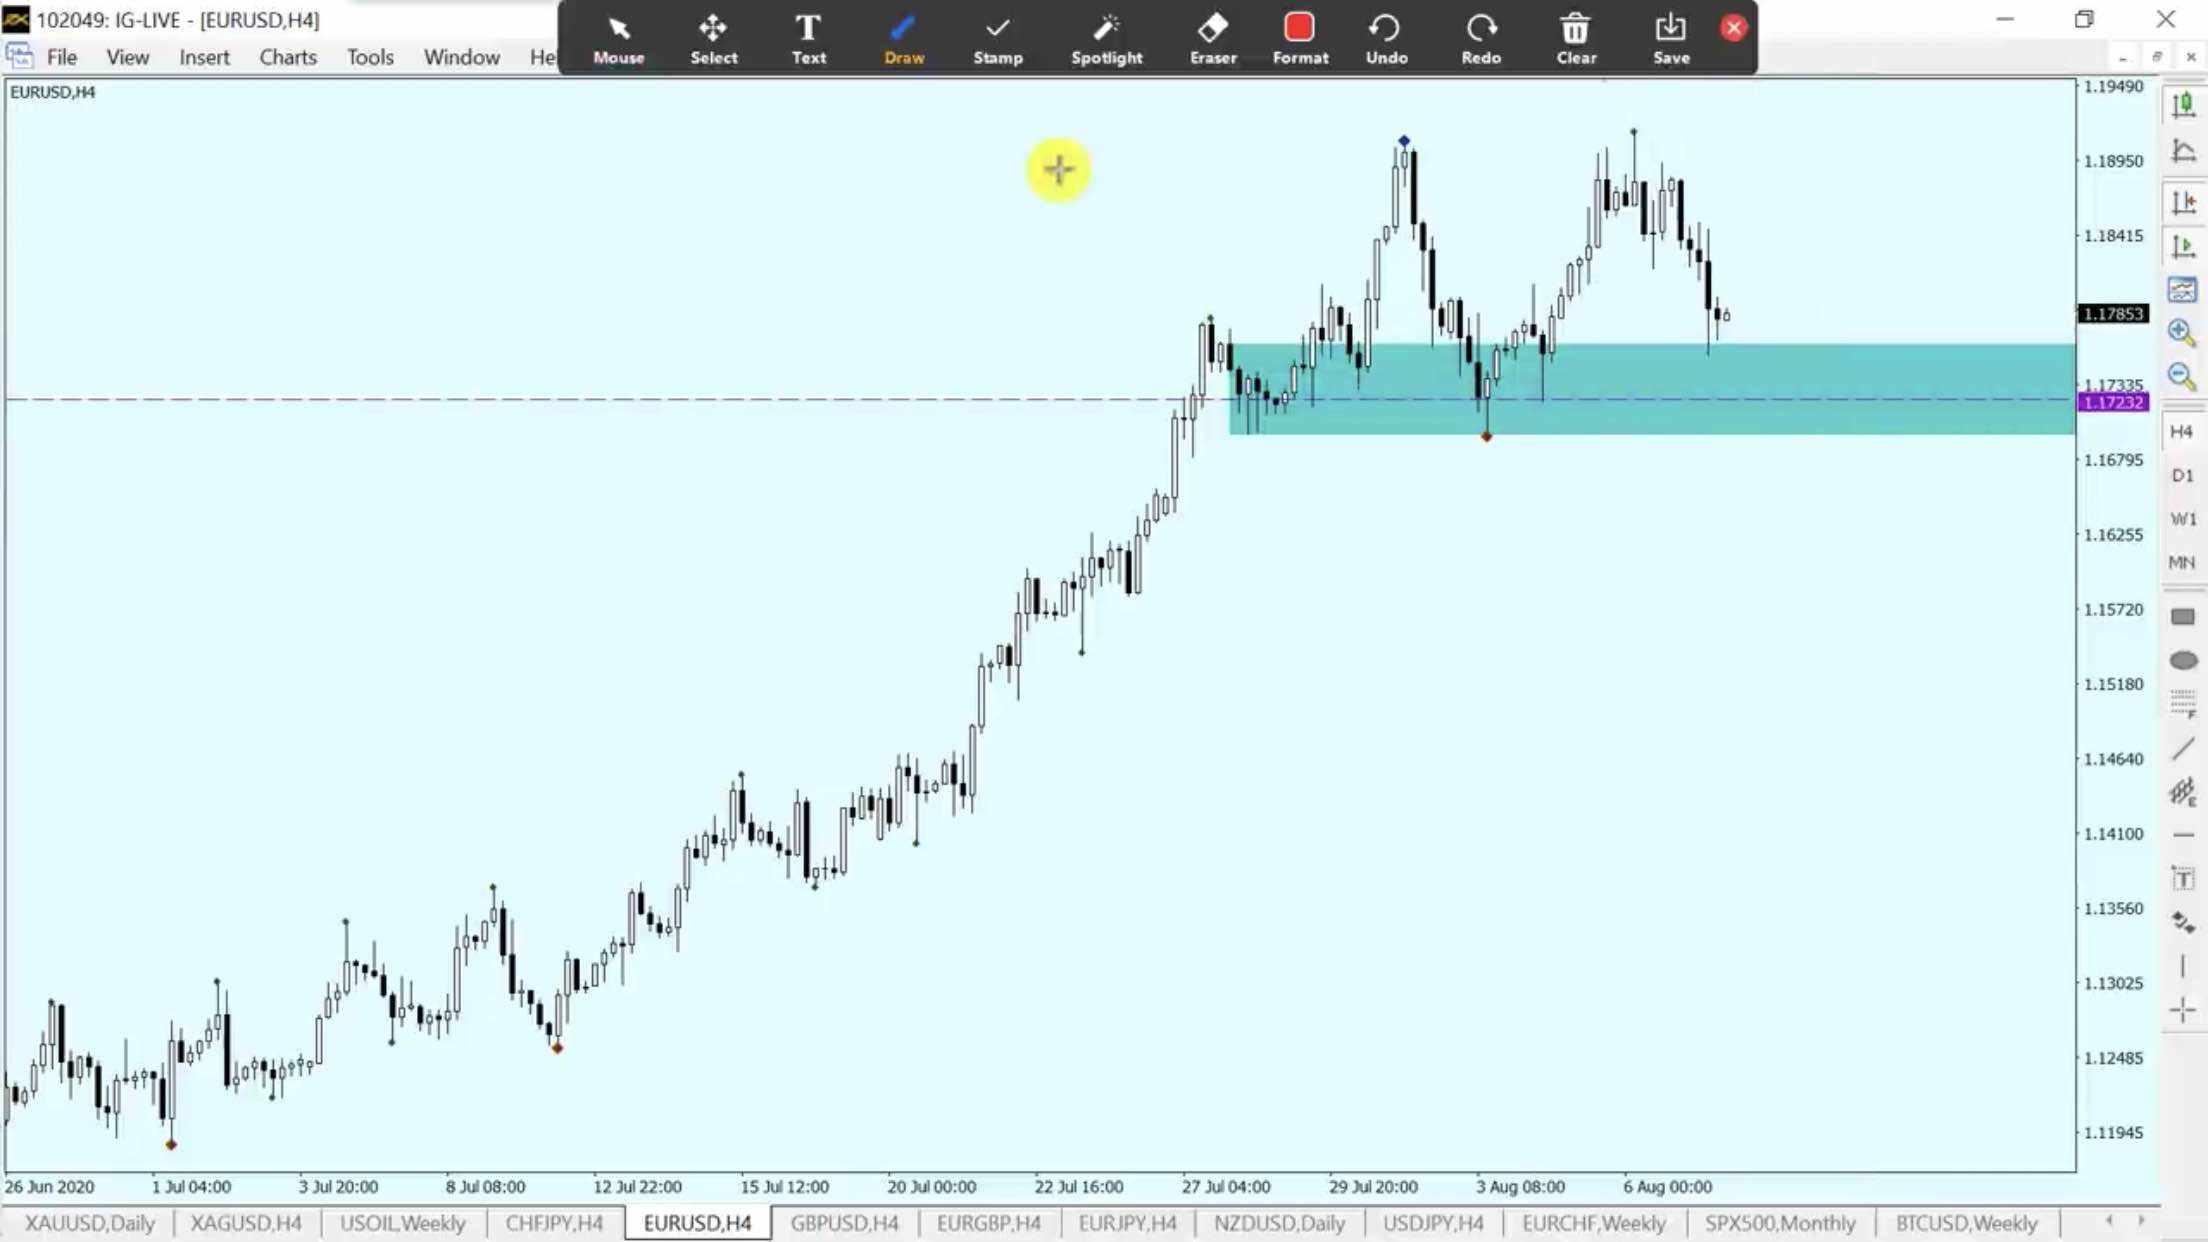
On the H4 chart, we can see clearly about the support area at the price 1.17232. Please wait for the price to arrive this area and a signal like pin bar up or inside bar to Buy.
Or you can BUY Limit at 1.17232, Stop loss at 1.16940, take profit at 1.1920 or 1.2000
This is my own opinion about the market, please always put stop loss to advoid risk.
風險提示:本文所述僅代表作者個人觀點,不代表 Followme 的官方立場。Followme 不對內容的準確性、完整性或可靠性作出任何保證,對於基於該內容所採取的任何行為,不承擔任何責任,除非另有書面明確說明。
喜歡的話,讚賞支持一下

暫無評論,立馬搶沙發