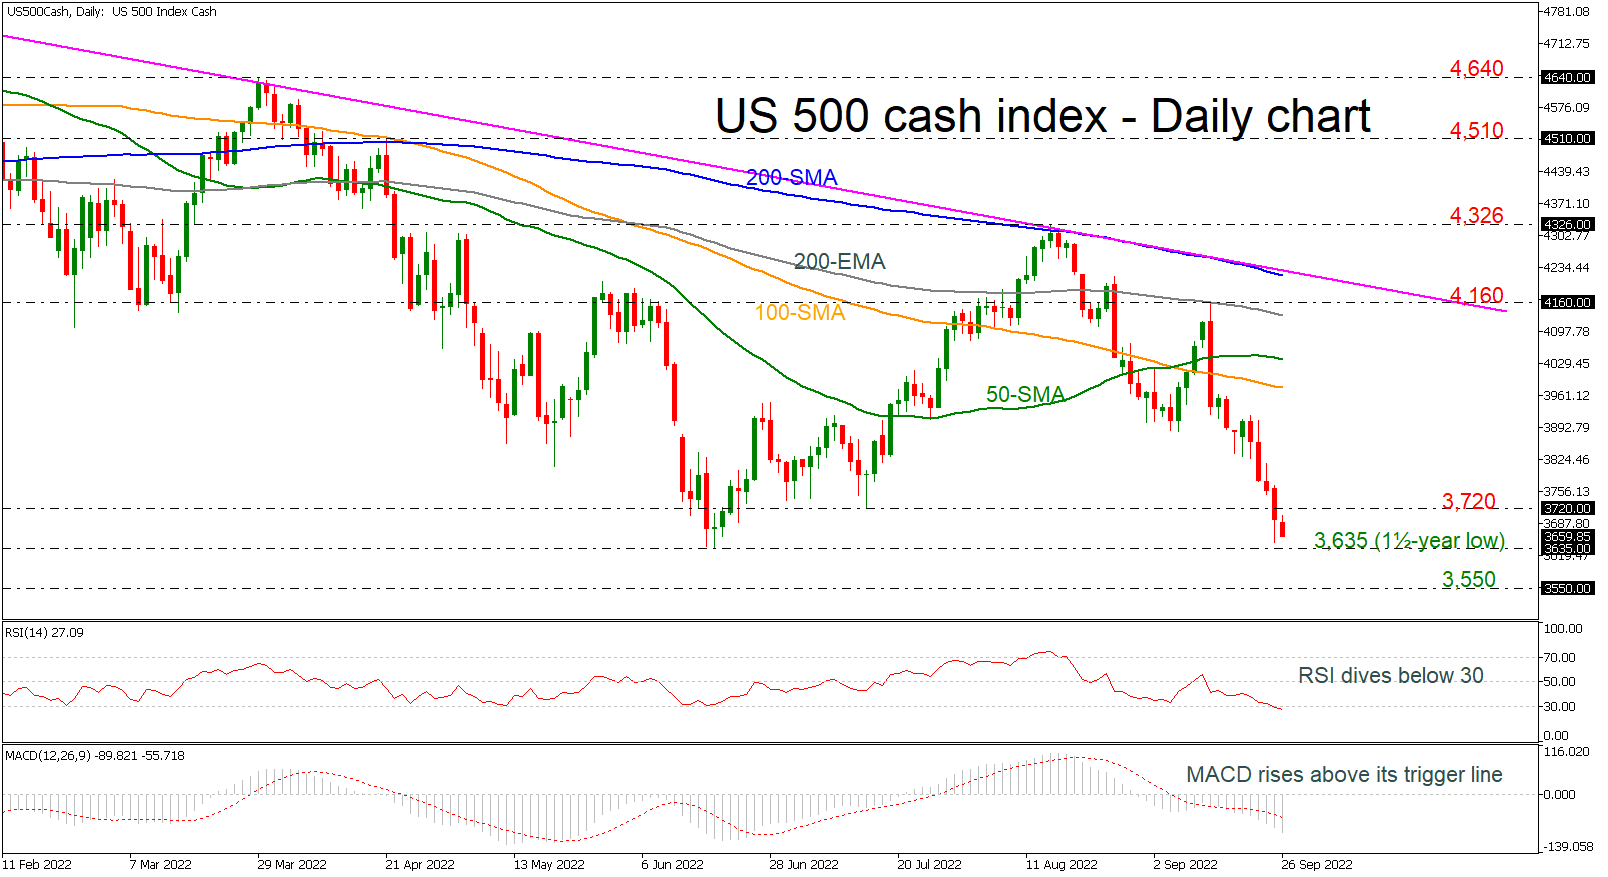
The US 500 cash index has been underperforming over the last five daily sessions, but the strong negative momentum started after the pullback off the 200-day exponential moving average (EMA). The price is approaching the one-and-a-half-year low of 3,635, endorsing the long-term bearish structure.
The momentum indicators, are currently encouraging that sell-off as the RSI is declining beneath the 30 level, entering the oversold territory, while the MACD is extending its bearish movement below its trigger and zero lines.
In the event of a downfall underneath the 3,635 support, the next level to have in mind is the inside swing high from October 2020 at 3,550, while even lower the 3,233 mark could come in focus.
However, a closing price above 3,720 could boost buying interest and confirm additional gains towards the 100- and then the 50-day simple moving averages (SMAs) at 3,978 and 4,040 correspondingly. Above that, the 200-day EMA 4,132 and the 4,160 barrier could also react as resistance ahead of the long-term descending trend line, which overlaps with the 200-day SMA at 4,220.
Meanwhile in the medium-term picture, the outlook remains strongly bearish following this month’s free-fall, with traders waiting a rally above the 200-day SMA to eliminate fears of a down-trending market.
風險提示:本文所述僅代表作者個人觀點,不代表 Followme 的官方立場。Followme 不對內容的準確性、完整性或可靠性作出任何保證,對於基於該內容所採取的任何行為,不承擔任何責任,除非另有書面明確說明。

暫無評論,立馬搶沙發