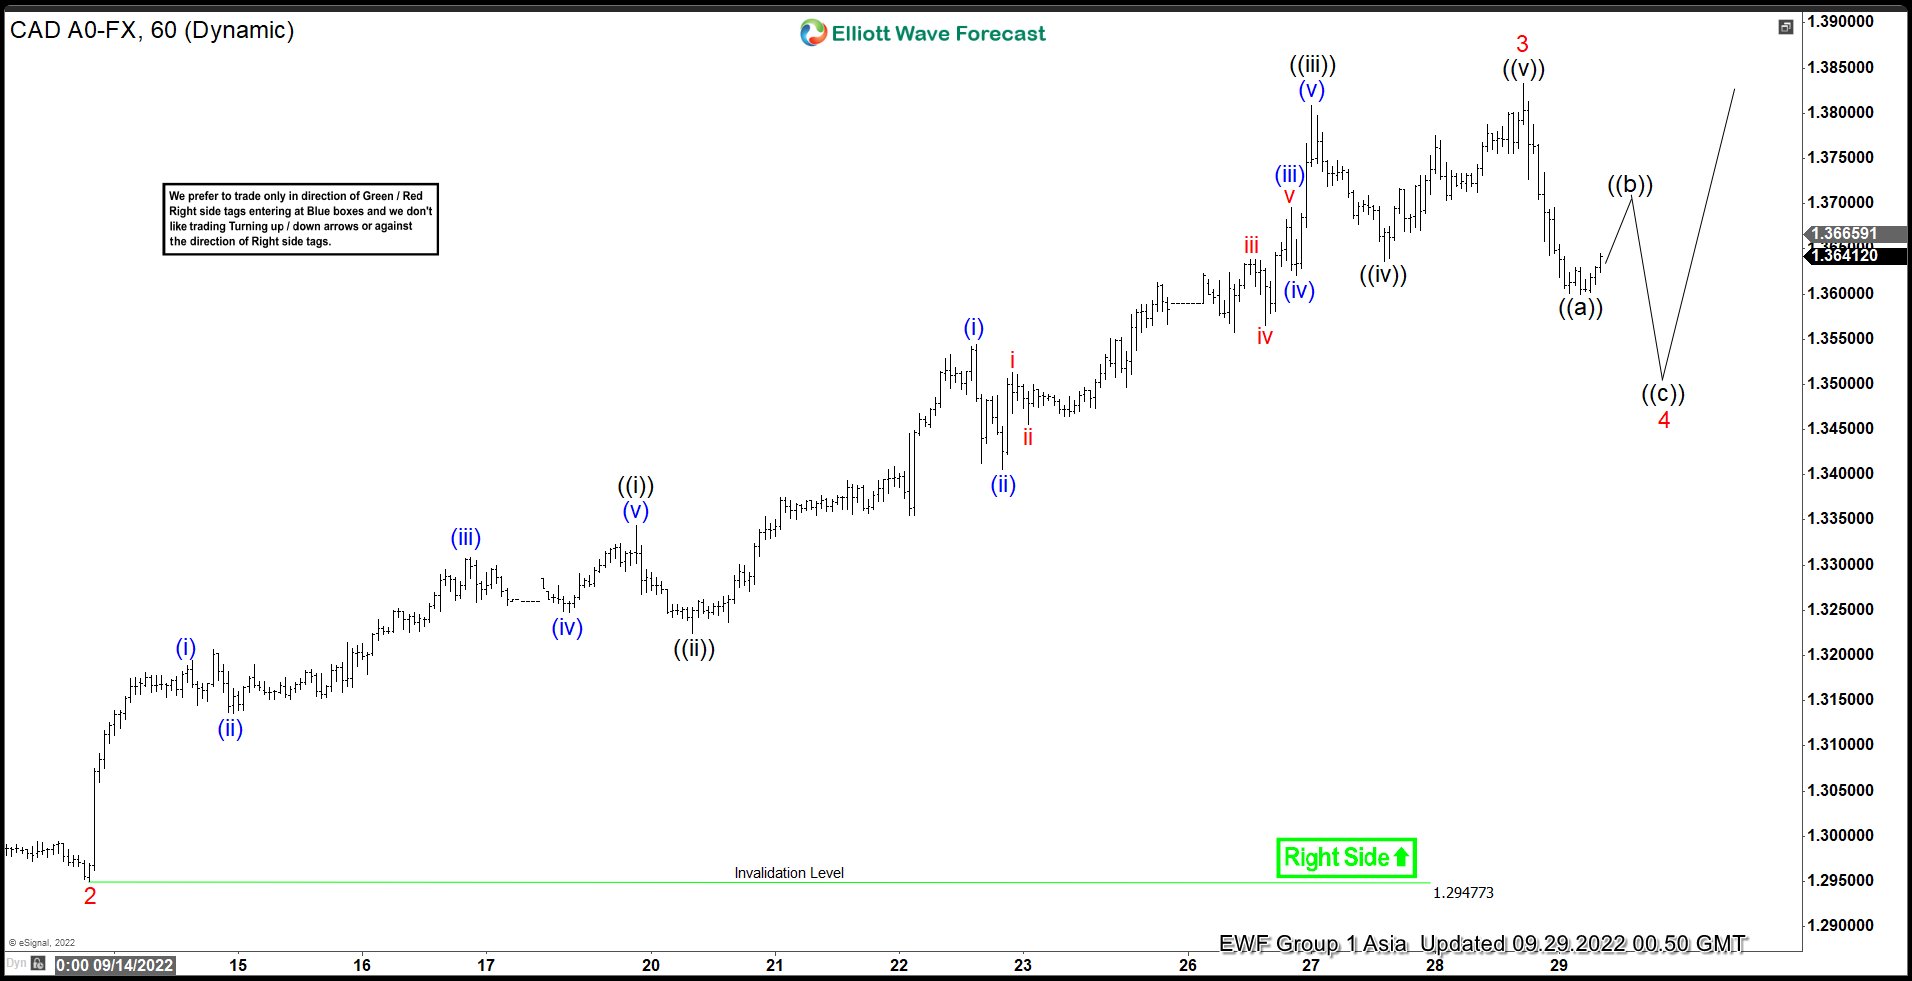
Short term Elliott Wave view on USDCAD suggests cycle from 8.11.2022 low is in progress as a 5 waves impulse structure. Up from 8.11.2022 low, wave 1 ended at 1.3208 and pullback in wave 2 ended at 1.2954. Pair has resumed higher in wave 3 with internal subdivision in another 5 waves of lesser degree. Up from wave 2, wave ((i)) ended at 1.3344 and pullback in wave ((ii)) ended at 1.3224. Pair then resumes higher in wave ((iii)) towards 1.3808 and dip in wave ((iv)) ended at 1.3636. Final leg higher wave ((v)) ended at 1.3833 which completed wave 3.
When measured from 8.11.2022 low relative to 9.13.2022 low, the rally to 1.3833 is around the 161.8% Fibonacci extension. This is the typical extension for wave 3. Pullback in wave 4 is now in progress to correct cycle from 9.13.2022 low. Pullback should take the form of 3 waves zigzag where wave ((a)) ended at 1.3601. Expect rally in wave ((b)) to fail for another leg lower in wave ((c)) to end wave 4. Potential area to end wave 4 is at 38.2 – 50% retracement of wave 3 at 1.339 – 1.3495. Near term, as far as pivot at 1.2947 low stays intact, expect pullback to find support in 3, 7, or 11 swing for further upside.
USDCAD 60 Minutes Elliott Wave Chart
風險提示:本文所述僅代表作者個人觀點,不代表 Followme 的官方立場。Followme 不對內容的準確性、完整性或可靠性作出任何保證,對於基於該內容所採取的任何行為,不承擔任何責任,除非另有書面明確說明。

暫無評論,立馬搶沙發