Key Highlights
- GBP/USD is correcting higher above the 1.1250 resistance.
- A key contracting triangle is forming with resistance near 1.1380 on the 4-hours chart.
- EUR/USD is slowly moving higher towards the 1.0000 resistance.
- Bitcoin price is still consolidating near the $19,500 resistance zone.
GBP/USD Technical Analysis
The British Pound formed a base above the 1.1000 against the US Dollar. GBP/USD started a recovery wave and was able to climb above the 1.1200 resistance.
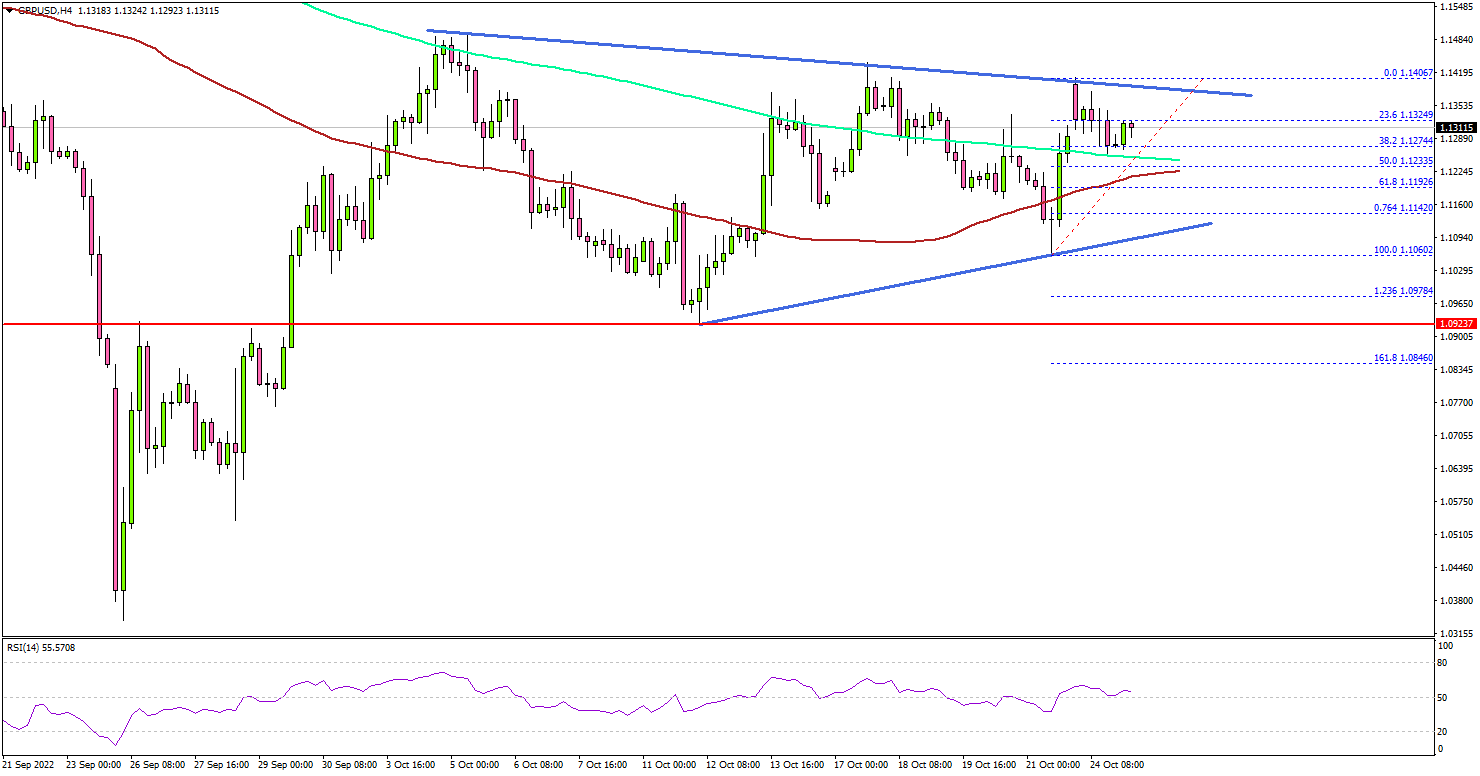
Looking at the 4-hours chart, the pair settled above the 1.1250 level, the 100 simple moving average (red, 4-hours), and the 200 simple moving average (green, 4-hours).
The bulls attempted to clear the 1.1400 resistance zone, but struggled. A high was formed near 1.1406 and the pair is now consolidating gains. On the upside, an immediate resistance is near the 1.1380 zone. There is also a key contracting triangle forming with resistance near 1.1380 on the same chart.
The next major resistance on the upside may perhaps be near 1.1400. Any more gains could set the pace for a move towards the 1.1500 level. If there is a downside correction, the pair might test the 1.1200 support.
The next major support is near the 1.1140 level. A downside break below the 1.1140 support and the triangle lower trend line may perhaps send GBP/USD towards the 1.1050 support. Any more losses could lead the pair towards 1.1000.
Looking at bitcoin price, the bulls are still struggling to clear the $19,500 and $19,650 resistance levels, above which the price could accelerate higher.
Economic Releases
- German IFO Business Climate Index for Oct 2022 – Forecast 83.3, versus 84.3 previous.
- US Housing Price Index for August 2022 (MoM) – Forecast -0.3%, versus -0.6% previous.
風險提示:本文所述僅代表作者個人觀點,不代表 Followme 的官方立場。Followme 不對內容的準確性、完整性或可靠性作出任何保證,對於基於該內容所採取的任何行為,不承擔任何責任,除非另有書面明確說明。

暫無評論,立馬搶沙發