The $USDX peaked back on 09.29.2022. Since then, the Index has been dropping. The Index is at risk of ending the cycle since the lows back in 2008. This means a huge selling could be happening now. We explained the idea in this article, published on 09.21.2022. We knew the $USDX was about to enter wave 4. At this stage, that's where we think the Index is. Wave four should still extend lower due to bearish sequence in pairs like the $USDSEK and $USDMXN. Both these pairs have not yet reached the target within their own sequence. The $USDMXN peaked on 04.2020. Since then, it has been doing an ABC lower. It already erased the divergence between A and C, but it has not yet reached the ideal Blue Box target.
Monthly USDMXN Elliott Wave Chart
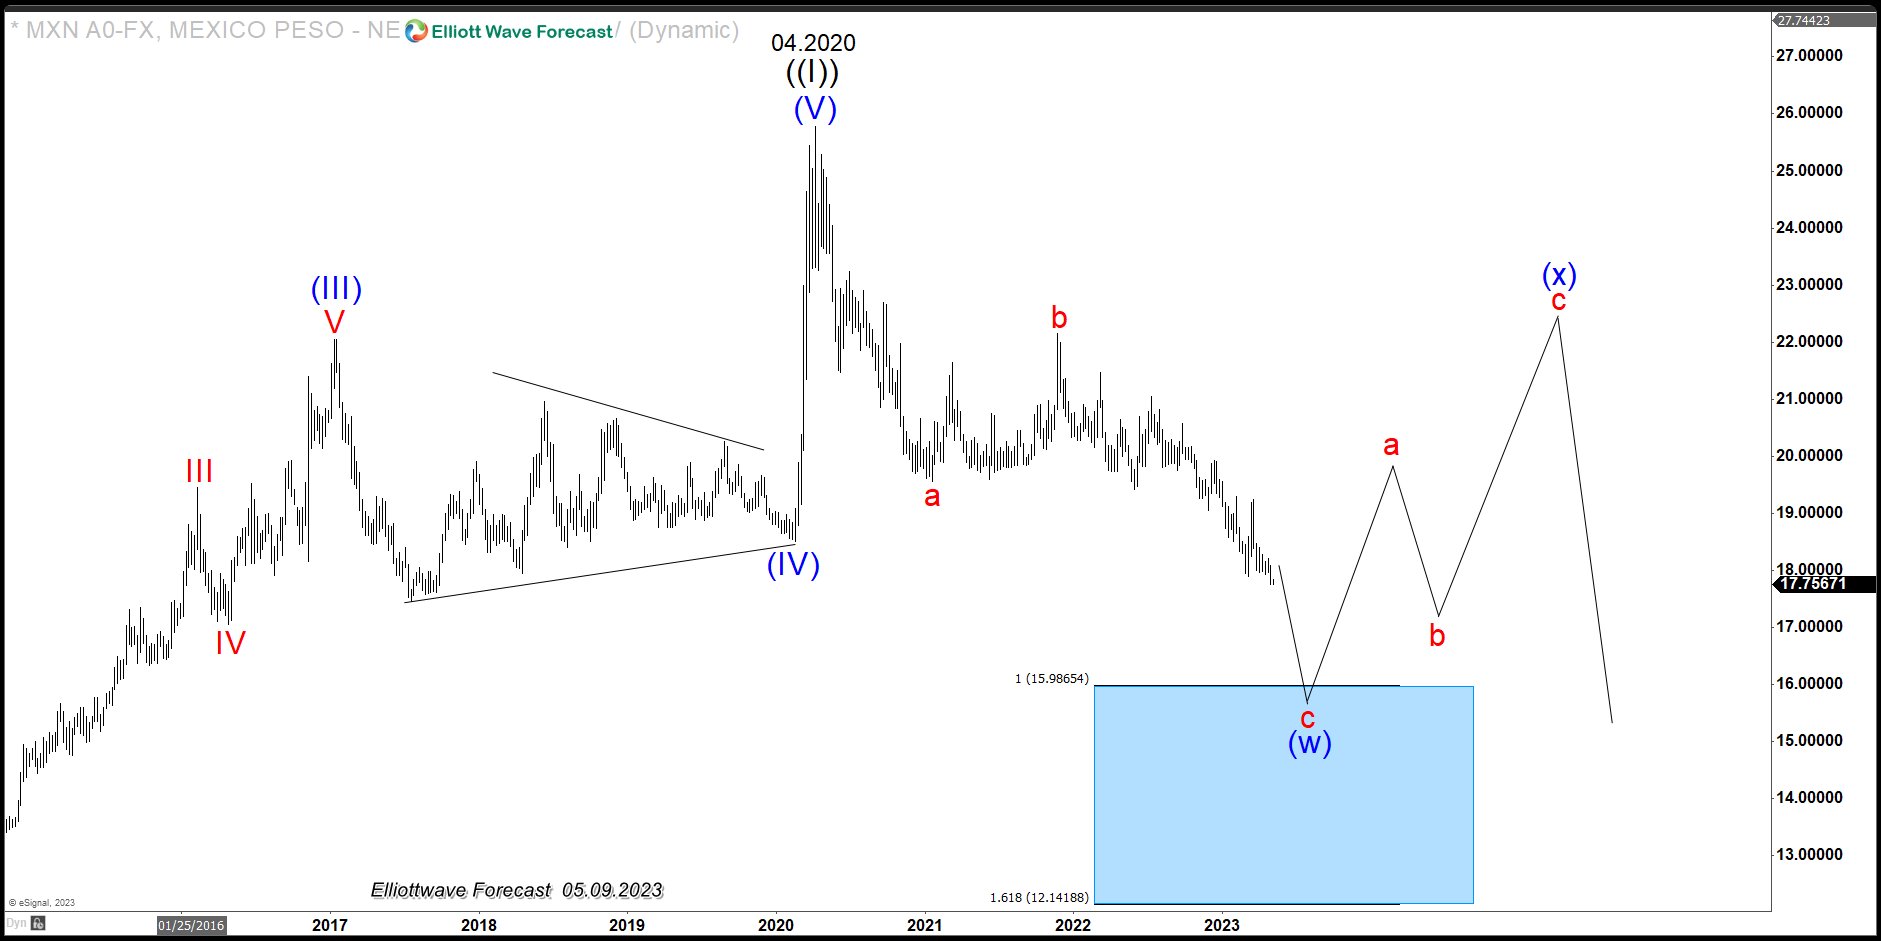
The chart above shows the monthly view of the $USDMXN and the blue box target where buyers should enter the market. The $USDSEK also shows a bearish sequence from the peak on 09.28.2022. It shows two channels, and the second one comes with momentum divergences. The decline from the peak has a corrective structure, which we labeled as WXY. Now we are entering wave Y leg, which should also reach the extreme. We expect both pairs to trade lower. If that is the case, $USDX should be weak consequently.
Daily $USDSEK Elliott Wave Chart
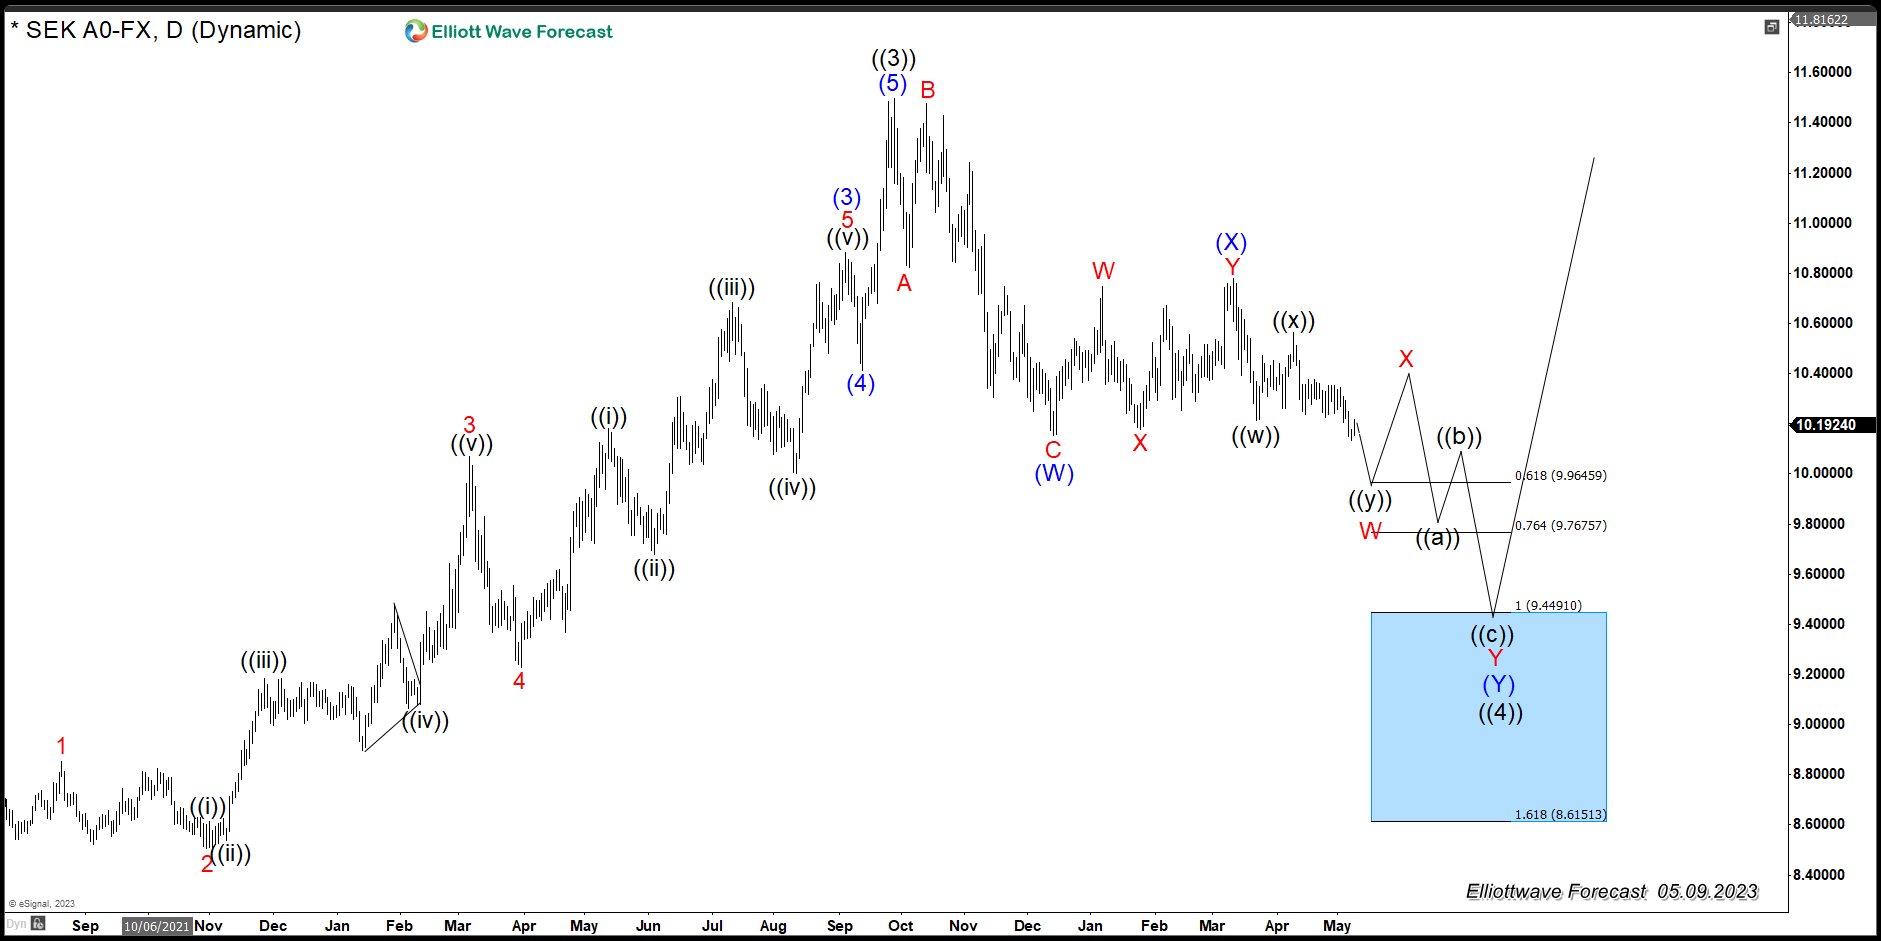
The chart above shows the $USDSEK Daily view and how the pair should move. The divergence between wave (W) and (Y) needs to be erased by the time we reach the blue box target.
風險提示:本文所述僅代表作者個人觀點,不代表 Followme 的官方立場。Followme 不對內容的準確性、完整性或可靠性作出任何保證,對於基於該內容所採取的任何行為,不承擔任何責任,除非另有書面明確說明。

暫無評論,立馬搶沙發