TransDigm Group Inc (NYSE: TDG), a leading player in the aerospace industry, has been making significant strides in recent times. Despite facing challenges in the market, the company has managed to maintain a strong upward trajectory. This article aims to dive into the Elliott Wave technical analysis of TransDigm Group's stock, exploring the bullish patterns and potential opportunities that lie ahead for investors.
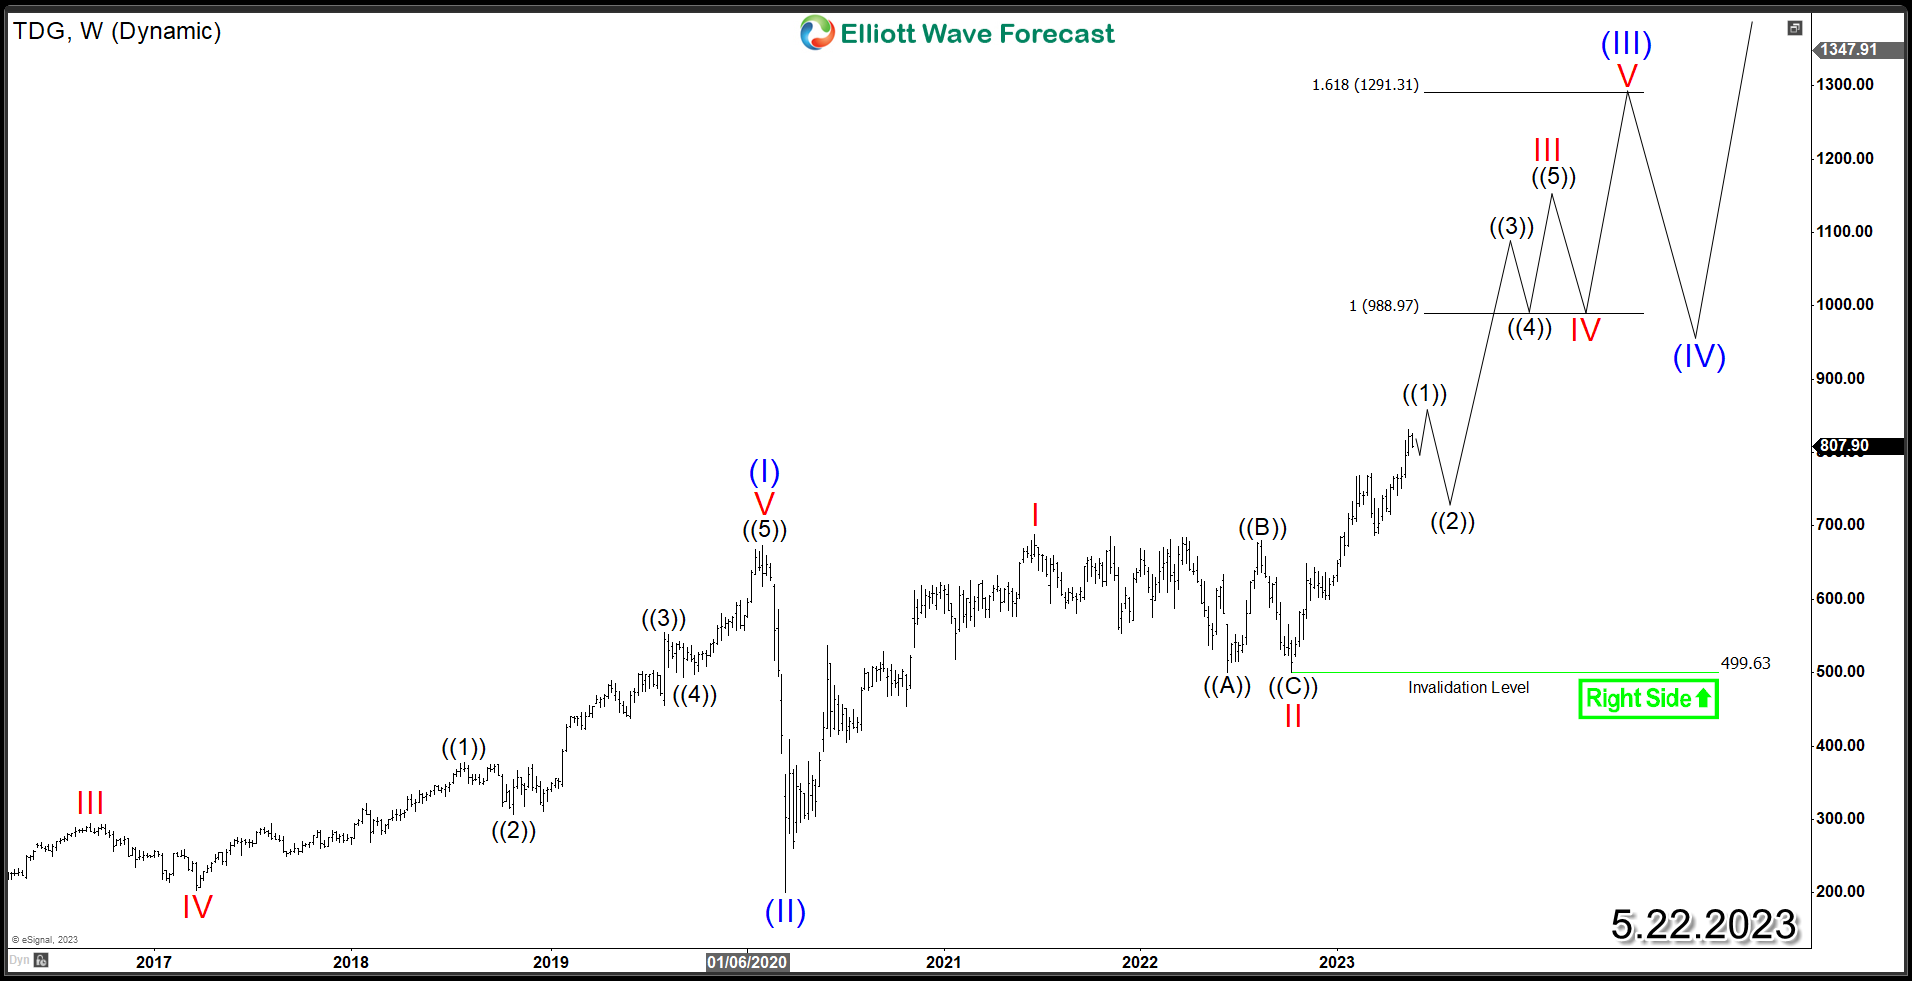
TDG rally off 2020 low is proposed to be within an extended 3rd wave which is usually the longest and strongest wave within the cycle. The stock should present daily investment opportunities during corrective pullbacks while it holds above $499 low.
TDG managed to created a bullish sequence earlier this year after breaking above 2021 peak. The move higher opened more weekly upside toward equal legs area at $988 - $1291. Consequently, buyers should be looking to buy the next pullback in wave ((2)) after it ends the cycle from October 2022.
With a bullish technical outlook and increasing demand for aerospace products, TransDigm Group Inc (NYSE: TDG) is well-positioned for long-term success. As the company continues to navigate market challenges, its strong performance and growth potential make it an attractive investment opportunity.
TDG Elliott Wave Weekly Chart
風險提示:本文所述僅代表作者個人觀點,不代表 Followme 的官方立場。Followme 不對內容的準確性、完整性或可靠性作出任何保證,對於基於該內容所採取的任何行為,不承擔任何責任,除非另有書面明確說明。

暫無評論,立馬搶沙發