Salesforce Inc (NYSE: CRM) is a leading player in the cloud computing industry, well-positioned for continued growth and success. This article explores the potential bullish technical structure of CRM using the Elliott Wave Theory.
Between November 2021 and December 2022, CRM encountered a one-year decline. This downward movement resulted in a substantial drawdown of 59.5% from its all-time high. The downward move can be characterized as a three-wave zigzag structure. It serves as a correction for the entire cycle since the company's IPO in 2004.
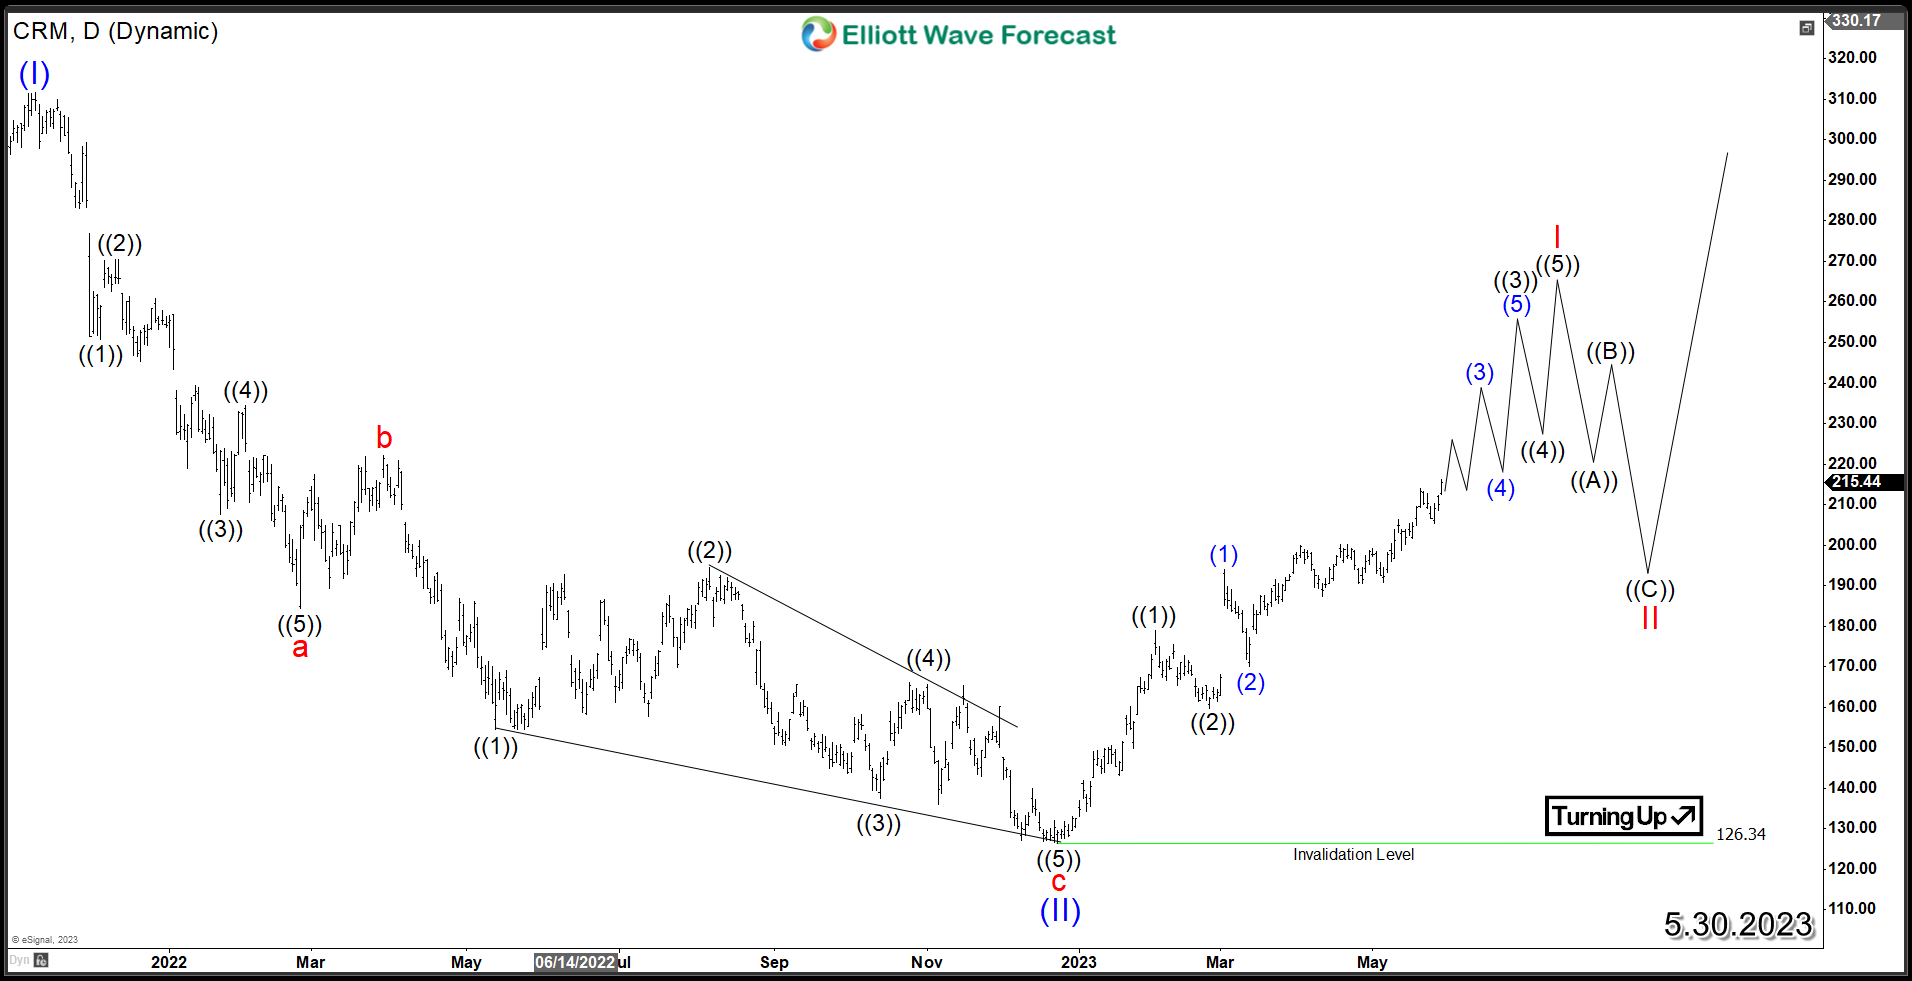
The low from last year at$126.34 is proposed to be a wave (II). Therefore we expect the stock to start rallying higher within a strong wave (III) leading to new all time highs. The initial rally is unfolding as an impulsive 5 waves structure within wave I. The internal cycle from February low, is still suggesting further upside as a result of nesting behavior taking place in the short term.
CRM could aim at least for the 1.618 Fibionnacie extension area at $244 which usually gets reached within a regular impulse. That target can be exceeded if the stock continue the rally within an extended 3rd wave.
In Conclusion, the current bullish structure since December 2022 is key for the stock to sustain the move higher and consequently investors can be looking for the next daily pullback to provide a buying opportunity. The potential correction in wave II ideally can take place in the second half of this year when the rally in wave I will have enough number of swings which isn't the case for now.
CRM Elliott Wave Daily Chart
風險提示:本文所述僅代表作者個人觀點,不代表 Followme 的官方立場。Followme 不對內容的準確性、完整性或可靠性作出任何保證,對於基於該內容所採取的任何行為,不承擔任何責任,除非另有書面明確說明。

暫無評論,立馬搶沙發