


| Scenario | |
|---|---|
| Timeframe | Weekly |
| Recommendation | SELL STOP |
| Entry Point | 0.6565 |
| Take Profit | 0.6469, 0.6347 |
| Stop Loss | 0.6630 |
| Key Levels | 0.6347, 0.6469, 0.6591, 0.6713, 0.6835 |
| Alternative scenario | |
|---|---|
| Recommendation | BUY STOP |
| Entry Point | 0.6715 |
| Take Profit | 0.6835 |
| Stop Loss | 0.6620 |
| Key Levels | 0.6347, 0.6469, 0.6591, 0.6713, 0.6835 |
Current trend
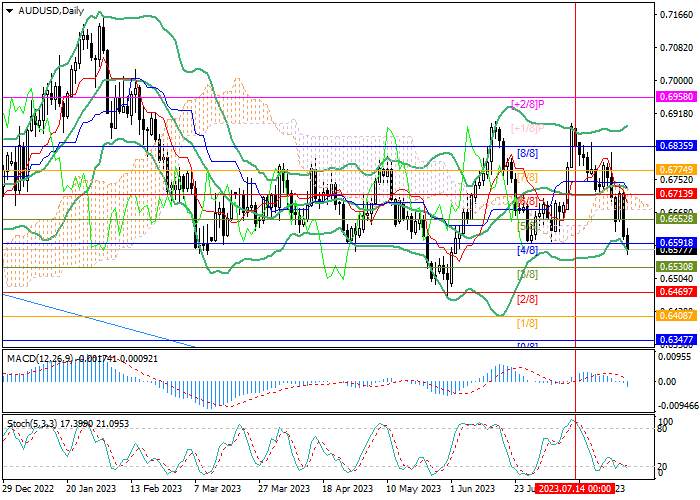
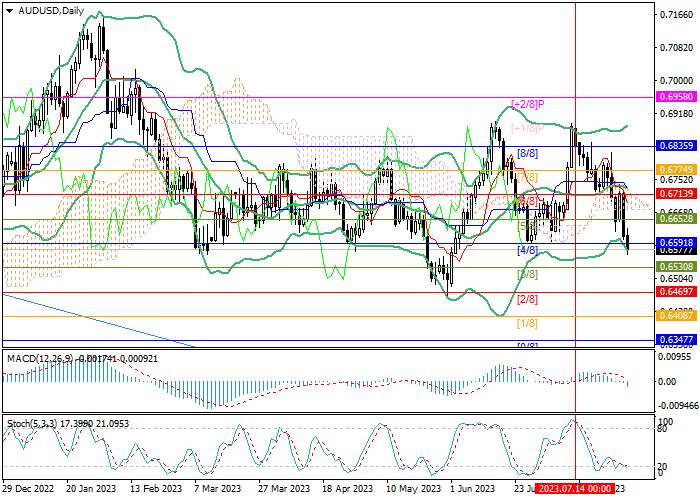
The quotes of the AUD/USD pair are currently testing the 0.6591 mark (Murray level [4/8]).
The Australian currency is under pressure after the Reserve Bank of Australia (RBA) meeting. Recall that for the second month in a row, the regulator left the interest rate at 4.10% instead of raising it by 25 basis points, as most market participants expected. Officials said that a pause in the tightening cycle will give additional time to assess the economic consequences of the adjustments already made, but if necessary, officials are ready to return to the "hawkish" course. However, many experts exclude the possibility of new increases. On Thursday, investors expect the publication of July data on the index of business activity in the service sector. It is likely that the indicator will decrease from 50.3 points to 48.0 points and will be in the stagnation zone for the first time since March. The implementation of this forecast may put additional pressure on the national currency.
As for the USD, the bidders predict further actions of the US Fed. It is not yet clear whether officials will raise the interest rate again or keep it at the current level, and much here will depend on the regulator's reaction to a series of July data from the US labor market, which will be presented this week. So, for today the publication of employment statistics from Automatic Data Processing (ADP) is planned: probably, the indicator will adjust from 497.0K to 189.0K. If the scenario is implemented, the US Fed will receive another argument in favor of ending the "hawkish" course of monetary policy.
Support and resistance
Currently, the price is testing the 0.6591 mark (Murray level [4/8]), consolidation below which will allow the quotes to develop a decline to the levels of 0.6469 (Murray level [2/8]) and 0.6347 (Murray level [0/8]). The key for the "bulls" is the level of 0.6713 (Murray level [6/8]), consolidation of the price above it and the middle line of the Bollinger Bands will ensure continued growth to the area of 0.6835 (Murray level [8/8]).
Technical indicators do not give a single signal: the Bollinger Bands are horizontal, the Stochastic has reached the oversold zone and may reverse upwards, the MACD histogram has moved into the negative zone.
Support and resistance
Resistance levels: 0.6713, 0.6835.
Support levels: 0.6591, 0.6469, 0.6347.
Trading tips
Short positions may be opened from 0.6565 with targets at 0.6469, 0.6347 and stop-loss in the area of 0.6630. Implementation period: 5-7 days.
Long positions can be opened above 0.6713 with a target at 0.6835 and stop-loss at around 0.6620.
風險提示:本文所述僅代表作者個人觀點,不代表 Followme 的官方立場。Followme 不對內容的準確性、完整性或可靠性作出任何保證,對於基於該內容所採取的任何行為,不承擔任何責任,除非另有書面明確說明。

暫無評論,立馬搶沙發