


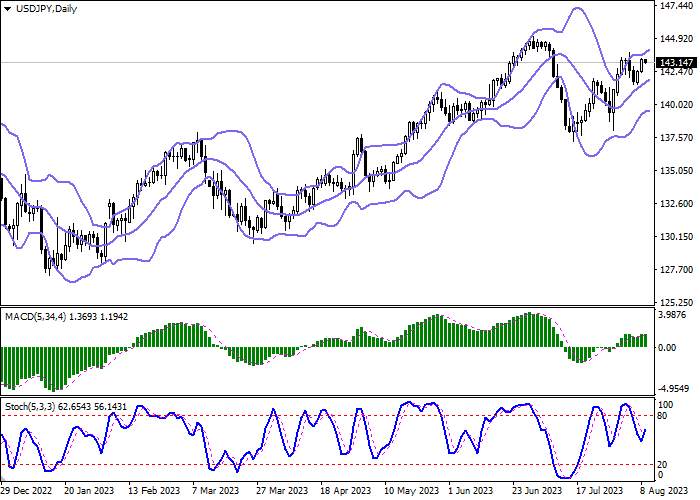
| Scenario | |
|---|---|
| Timeframe | Intraday |
| Recommendation | BUY STOP |
| Entry Point | 143.50 |
| Take Profit | 145.00 |
| Stop Loss | 142.80 |
| Key Levels | 140.50, 141.50, 142.00, 142.54, 143.48, 144.00, 145.00, 146.00 |
| Alternative scenario | |
|---|---|
| Recommendation | SELL STOP |
| Entry Point | 142.50 |
| Take Profit | 141.50 |
| Stop Loss | 143.00 |
| Key Levels | 140.50, 141.50, 142.00, 142.54, 143.48, 144.00, 145.00, 146.00 |
Current trend
The US currency is correcting around 143.12 after a two-day growth at the beginning of the week, when the USD/JPY pair managed to renew local highs from August 3. Market activity remains low as market participants await the publication of macroeconomic statistics from the US on consumer and producer inflation.
Forecasts assume a slight increase in the annual value from 3.0% to 3.3%, while the production indicator will correct more significantly, from 0.1% to 0.7%. In addition, at the end of the week, investors will follow the comments of the US Federal Reserve, in particular, Patrick Harker and Rafael Bostic. Traders fear that a resumption of growth in consumer prices could act as a catalyst to prolong the "hawkish" monetary policy and lead to another increase in interest rates this year. In July, officials did not rule out the possibility of new adjustments, bringing the figure to 5.5%.
Meanwhile, macroeconomic statistics from Japan, presented the day before, did not support the yen: Household Spending fell 4.2% YoY in June after falling 4.0% earlier, while Bank Lending slowed from 3.1% YoY to 2.9% last month, worse than the expected 3.1%. In turn, the current account balance of Japan in June showed positive dynamics for the fifth month in a row: the surplus amounted to 1.509 trillion yen, exceeding the 1.395 trillion yen expected by experts and improving the figure for the same period last year by 1.0 trillion yen. National Finance Ministry officials noted that the trade balance rose to a surplus of 328.0 trillion yen. Thus, the statistics confirmed the impact of high energy prices and a weak yen on the third largest economy in the world, which is largely dependent on imported fuels and raw materials.
Support and resistance
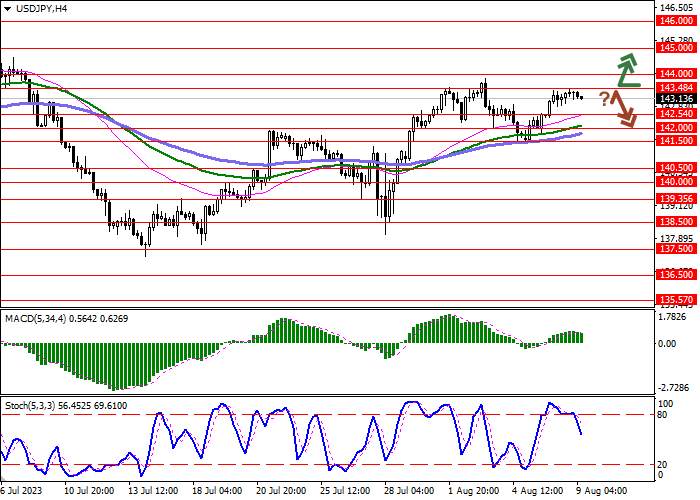
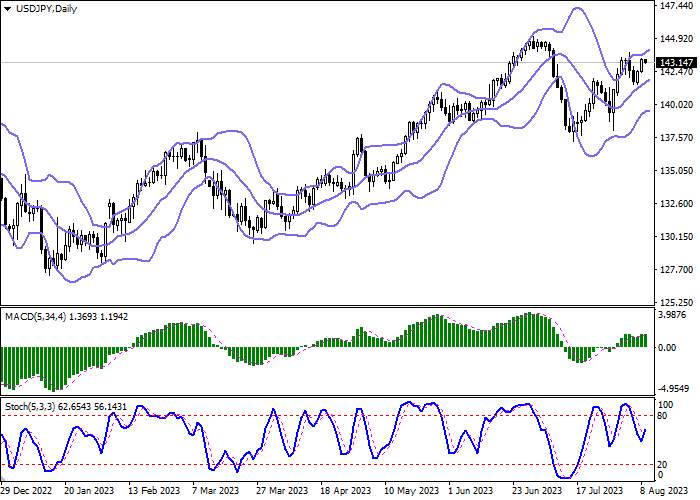
On the daily chart, Bollinger Bands are steadily growing. The price range expands from above, freeing a path to new local highs for the "bulls". MACD maintains an uncertain upward trend and a buy signal, being located above the signal line. Stochastic after a short decline last week reversed into an upward plane, reacting to the "bullish" dynamics at the beginning of the current trading week. At the same time, the indicator is quite close to the level of "80", pointing to the rapidly increasing risks of the US dollar being overbought in the ultra-short term.
Resistance levels: 143.48, 144.00, 145.00, 146.00.
Support levels: 142.54, 142.00, 141.50, 140.50.
Trading tips
Long positions can be opened after a breakout of 143.48 with the target of 145.00. Stop-loss — 142.80. Implementation time: 2-3 days.
A rebound from the level of 143.48 followed by a breakdown of 142.54 may be a signal to open short positions with the target at 141.50. Stop-loss — 143.00.
風險提示:本文所述僅代表作者個人觀點,不代表 Followme 的官方立場。Followme 不對內容的準確性、完整性或可靠性作出任何保證,對於基於該內容所採取的任何行為,不承擔任何責任,除非另有書面明確說明。

暫無評論,立馬搶沙發