| Scenario | |
|---|---|
| Timeframe | Weekly |
| Recommendation | BUY STOP |
| Entry Point | 4400.5 |
| Take Profit | 4500.0 |
| Stop Loss | 4350.0 |
| Key Levels | 4200.0, 4300.0, 4400.0, 4500.0 |
| Alternative scenario | |
|---|---|
| Recommendation | SELL STOP |
| Entry Point | 4299.5 |
| Take Profit | 4200.0 |
| Stop Loss | 4350.0 |
| Key Levels | 4200.0, 4300.0, 4400.0, 4500.0 |
Current trend
The leading index of the American economy, the S&P 500, is correcting, trading at 4353.0.
This week, the dynamics of US stock markets are highly dependent on bond yields and expectations regarding changes in monetary policy by the US Federal Reserve. Investors are hoping that current interest rates are the highest of this cycle and there will be no further increases: yesterday, Atlanta Federal Reserve Bank (Fed) Governor Raphael Bostic said he believes rising borrowing costs had gone too far and markets might soon see their reduction. After this statement, experts strengthened their views on maintaining the indicator at 5.25–5.50% in November: according to the Chicago Mercantile Exchange (CME) FedWatch Instrument, confidence in this increased from 76.9% to 84.3%.
Investors expect positive factors so strongly that even a local slowdown in bond growth is perceived as a signal to buy: leading 10-year securities interrupted the global increase and are today trading at 4.4640%, which is slightly lower than the peak yield at the end of last week at 4.8000%. Experts remain concerned about the performance of short-term bonds, with 3-year Treasury bonds at 5.528%, a 23-year high.
Among the growth leaders are Truist Financial Corp. ( 6.67%), First Solar Inc. ( 5.40%), Enphase Energy Inc. ( 5.01%), and SolarEdge Technologies Inc. ( 4.84%).
Among the decliners are Netflix Inc. (–3.27%), W. W. Grainger Inc. (–2.07%), and Tapestry Inc. (–1.92%).
Support and resistance
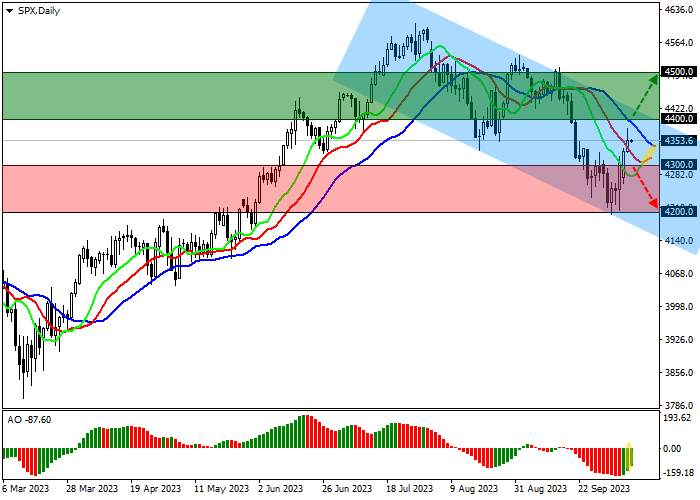
The trading instrument continues its local upward correction, approaching the resistance line of the global downward corridor with boundaries of 4400.0–4120.0 on the daily chart.
Technical indicators have almost reversed and are ready to issue a buy signal: fast EMAs on the Alligator indicator are actively approaching the signal line, and the AO histogram is forming ascending bars in the sales zone.
Resistance levels: 4400.0, 4500.0.
Support levels: 4300.0, 4200.0.

Trading tips
Long positions may be opened after the price rises and consolidates above 4400.0 with the target at 4500.0. Stop loss – 4350.0. Implementation period: 7 days or more.
Short positions may be opened after the price declines and consolidates below 4300.0 with the target at 4200.0. Stop loss – 4350.0.
風險提示:本文所述僅代表作者個人觀點,不代表 Followme 的官方立場。Followme 不對內容的準確性、完整性或可靠性作出任何保證,對於基於該內容所採取的任何行為,不承擔任何責任,除非另有書面明確說明。

暫無評論,立馬搶沙發