


| Scenario | |
|---|---|
| Timeframe | Weekly |
| Recommendation | SELL STOP |
| Entry Point | 51.30 |
| Take Profit | 47.40 |
| Stop Loss | 53.00 |
| Key Levels | 47.00, 51.30, 52.00, 53.00, 56.24, 56.90, 57.00 |
| Alternative scenario | |
|---|---|
| Recommendation | BUY STOP |
| Entry Point | 53.20 |
| Take Profit | 56.90 |
| Stop Loss | 52.00 |
| Key Levels | 47.00, 51.30, 52.00, 53.00, 56.24, 56.90, 57.00 |
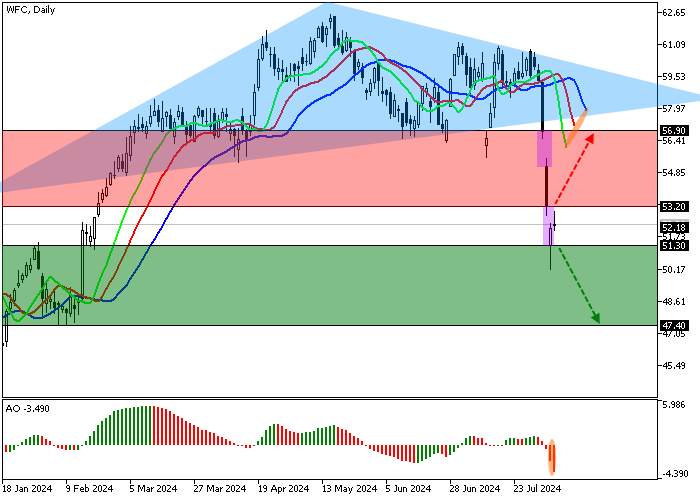
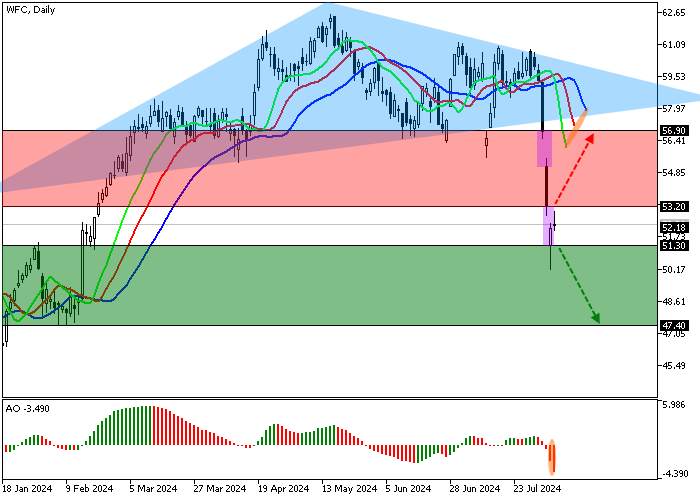
The stocks of Wells Fargo & Co., one of the leading banking and insurance companies in the United States, are trading at 52.00.
On the daily chart, the price is moving in a corrective trend, working out a downward signal after the implementation of the Head and shoulders reversal pattern with a Neckline of 57.00.
On the four-hour chart, the probability of a decline remains high against two price gaps, 56.90–56.24 and 53.20–51.30, indicating large sales volumes. Now, the quotes are working out the second gap, after which the negative dynamics may reach 47.00.
Technical indicators are strengthening the sell signal: the fast EMA of the Alligator indicator are below the signal line, expanding the range of fluctuations, and the AO histogram is forming downward bars below the transition level.
Trading tips
Short positions may be opened after the price declines and consolidates below 51.30, with the target at 47.40. Stop loss — 53.00. Implementation period: 7 days or more.
Long positions may be opened after the price grows and consolidates above 53.20, with the target at 56.90. Stop loss — 52.00.
風險提示:本文所述僅代表作者個人觀點,不代表 Followme 的官方立場。Followme 不對內容的準確性、完整性或可靠性作出任何保證,對於基於該內容所採取的任何行為,不承擔任何責任,除非另有書面明確說明。

暫無評論,立馬搶沙發