| Scenario | |
|---|---|
| Timeframe | Weekly |
| Recommendation | SELL STOP |
| Entry Point | 0.5450 |
| Take Profit | 0.4883, 0.4395 |
| Stop Loss | 0.5760 |
| Key Levels | 0.3906, 0.4300, 0.4883, 0.6348, 0.6836, 0.7324 |
| Alternative scenario | |
|---|---|
| Recommendation | BUY STOP |
| Entry Point | 0.6400 |
| Take Profit | 0.6836, 0.7324 |
| Stop Loss | 0.6000 |
| Key Levels | 0.3906, 0.4300, 0.4883, 0.6348, 0.6836, 0.7324 |
Current trend
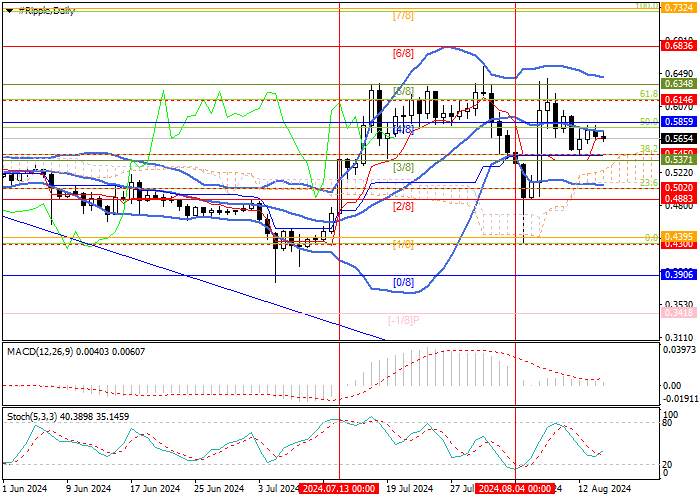
Last week, the XRP/USD pair demonstrated ambiguous dynamics. Amid fears of a recession in the US, the quotes fell to the July low of 0.4300 but then compensated for the lost positions, testing the 0.6348 mark (Murrey level [5/8]) amid the decision of Ripple to pay a fine of 125.0M dollars, significantly less than the 2.0B dollars required by the US Securities and Exchange Commission (SEC).
The price is moving within the sideways range of 0.6348–0.4883 (Murrey levels [5/8]–[2/8]) to its lower border, after consolidation below which the decline will continue to the area of 0.4300 and 0.3906 (Murrey level [0/8]). If the 0.6348 level, which the asset has been testing for two months, is overcome, an upward trend may develop towards the targets of 0.6836 (Murrey level [6/8]) and 0.7324 (Murrey level [7/8]).
Technical indicators do not give a single signal: Bollinger Bands are reversing downwards, Stochastic is reversing upwards, and the MACD histogram is preparing to move into the negative zone.
Support and resistance
Resistance levels: 0.6348, 0.6836, 0.7324.
Support levels: 0.4883, 0.4300, 0.3906.

Trading tips
Short positions may be opened from the 0.5450 level, with the targets of 0.4883, 0.4395 and stop loss of 0.5760. Implementation period: 5–7 days.
Long positions may be opened above 0.6348, with the targets at 0.6836, 0.7324 and stop loss 0.6000.
風險提示:本文所述僅代表作者個人觀點,不代表 Followme 的官方立場。Followme 不對內容的準確性、完整性或可靠性作出任何保證,對於基於該內容所採取的任何行為,不承擔任何責任,除非另有書面明確說明。

暫無評論,立馬搶沙發