| Scenario | |
|---|---|
| Timeframe | Intraday |
| Recommendation | BUY STOP |
| Entry Point | 0.6035 |
| Take Profit | 0.6068 |
| Stop Loss | 0.6010 |
| Key Levels | 0.5920, 0.5950, 0.5975, 0.6000, 0.6030, 0.6047, 0.6068, 0.6085 |
| Alternative scenario | |
|---|---|
| Recommendation | SELL STOP |
| Entry Point | 0.5995 |
| Take Profit | 0.5950 |
| Stop Loss | 0.6030 |
| Key Levels | 0.5920, 0.5950, 0.5975, 0.6000, 0.6030, 0.6047, 0.6068, 0.6085 |
Current trend
The NZD/USD pair is recovering losses after two sessions that brought the instrument to local lows from August 7. Quotes are testing 0.6015 for a breakout.
The New Zealand currency is supported by statements from the Governor of the Reserve Bank of New Zealand (RBNZ) Adrian Orr, who noted that current economic conditions in the country and abroad remain uncertain, as inflation is still stable despite the targeted move to the range of 1.0-3.0%. According to him, the measures taken by officials are sufficient to control the dynamics of consumer prices. Markets took the official's rhetoric as a signal that monetary policy will remain neutral in the near future: earlier the RBNZ cut the base interest rate to 5.25% for the first time since March 2020 and announced further adjustments in the coming months. Investors were pricing in a nearly 70.0% chance that borrowing costs would fall by 25 basis points following the weak economic data, while 19 of 31 economists polled by Reuters expected them to remain unchanged.
New Zealand released business activity data today, with the Manufacturing PMI accelerating to 44.0 points in July from 41.1 points. In addition, the Producer Price Input Index accelerated in the second quarter from 0.7% to 1.4%, while analysts expected a slowdown to 0.5%, and the Producer Price Output Index accelerated from 0.9% to 1.1%, contrary to forecasts of a slowdown to 0.6%. New Zealand's producer inflation data also helped dampen expectations of monetary easing from the RBNZ.
Meanwhile, the US currency was supported by data on US Retail Sales, which were published the day before: the July figure added 1.0% after –0.2% in the previous month, while experts expected 0.3%.
Support and resistance
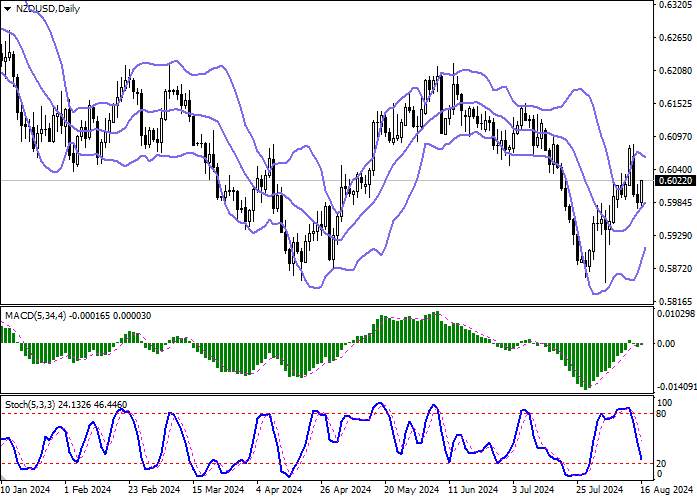
Bollinger Bands on the daily chart show a steady increase. The price range is narrowing, reflecting the emergence of ambiguous dynamics of trading in the short term. MACD indicator reversed to growth while trying to form a new buy signal (the histogram is about to consolidate above the signal line). Stochastic, on the contrary, maintains a confident downward direction and has not yet responded to the "bulls’" attempt to seize the initiative.
Resistance levels: 0.6030, 0.6047, 0.6068, 0.6085.
Support levels: 0.6000, 0.5975, 0.5950, 0.5920.


Trading tips
Long positions can be opened after a breakout of 0.6030 with the target of 0.6068. Stop-loss — 0.6010. Implementation time: 1-2 days.
A rebound from 0.6030 as from resistance, followed by a breakdown of 0.6000 may become a signal for opening of new short positions with the target at 0.5950. Stop-loss — 0.6030.
風險提示:本文所述僅代表作者個人觀點,不代表 Followme 的官方立場。Followme 不對內容的準確性、完整性或可靠性作出任何保證,對於基於該內容所採取的任何行為,不承擔任何責任,除非另有書面明確說明。

暫無評論,立馬搶沙發