



ByLCMS Traders FX Analysis Team
JUN 8, 2021
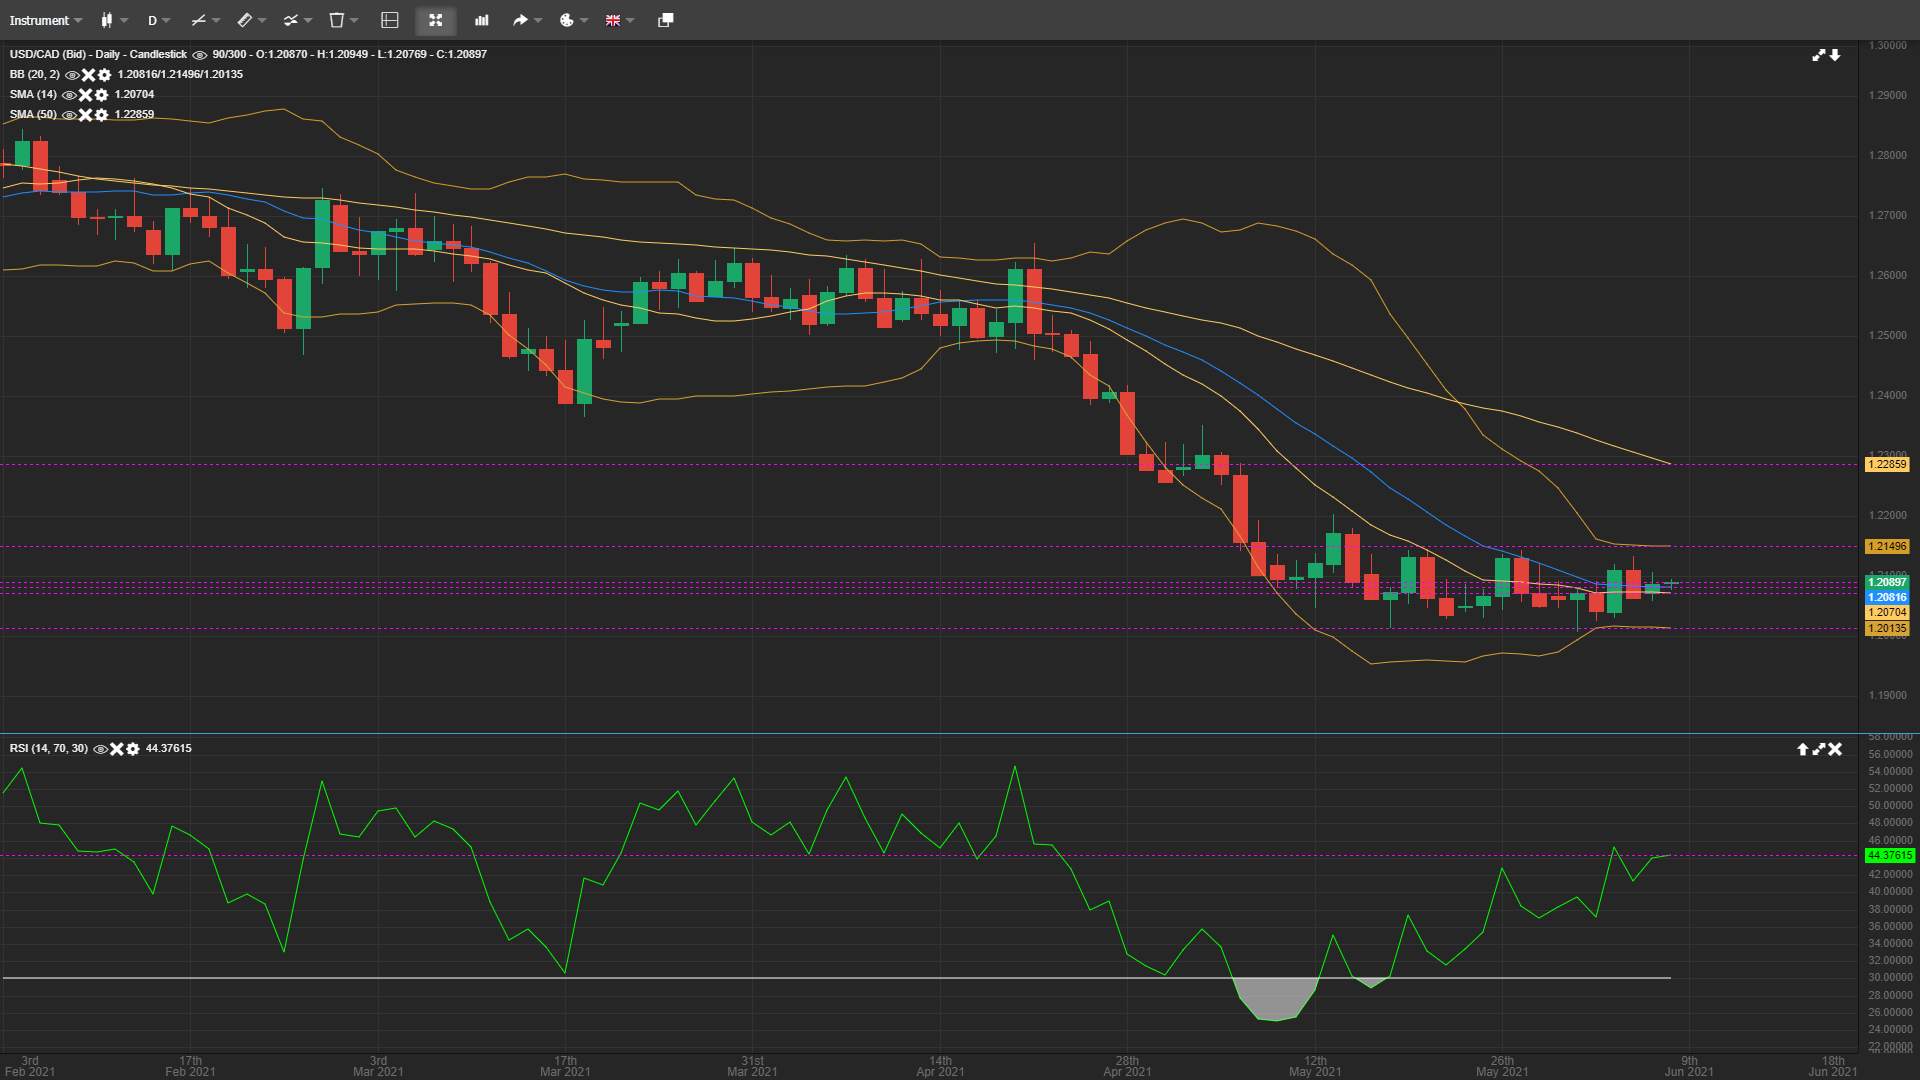
USD/CAD is moving in a narrow range for almost two weeks and is currently trading at 1.2089. The intraday support levels are at 1.2066 and 1.2035 while the psychological support level of 1.2000 is held so far. The intraday resistance levels are at 1.2100 and 1.2138.
On the intraday charts, the SMA-14 is indicating support at 1.2070 while the SMA-50 is indicating resistance way high at 1.2285. The pair is also above the mid-Bollinger band while the contracting upper and lower bands are indicating a squeeze. The RSI is 44 and appears flat while the MACD is below the zero line. Based on the intraday price pattern the pair is presenting opportunities on both sides. A buy entry would be ideal at the following levels.
Direction: Buy
Entry: 1.2060
Take Profit: 1.2010
Stop-Loss: 1.2035
On the flip side, a small rally above would be ideal for sell entries at the following levels
Direction: Sell
Entry: 1.2125
Take Profit: 1.2075
Stop-Loss: 1.2155
An intraday closing above 1.2130 would be an indication of an upside breakout while on the lower side an intraday closing below 1.2030 would strengthen bears to challenge the major support area of 1.2000 and move further lower.
風險提示:本文所述僅代表作者個人觀點,不代表 Followme 的官方立場。Followme 不對內容的準確性、完整性或可靠性作出任何保證,對於基於該內容所採取的任何行為,不承擔任何責任,除非另有書面明確說明。

暫無評論,立馬搶沙發