


· 閱讀量 287
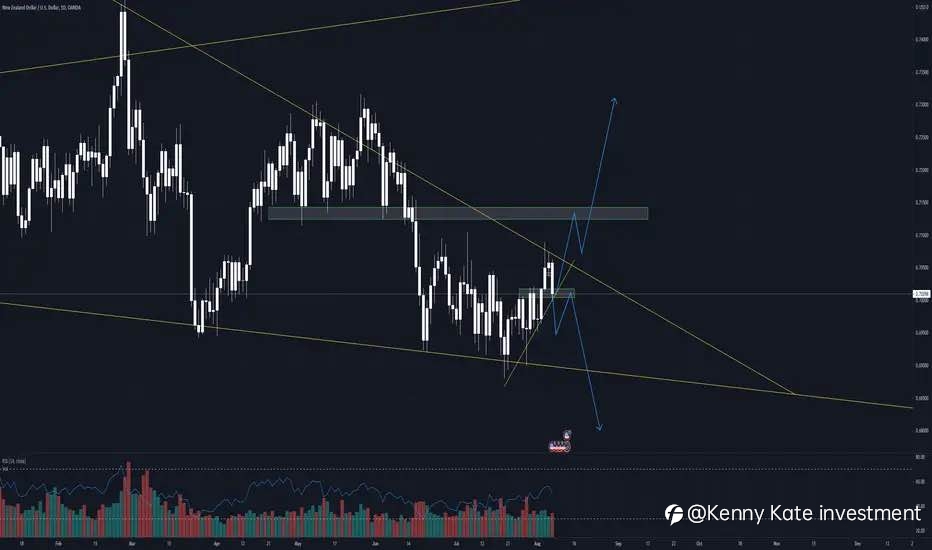
On this daily chart of NZDUSD , I am seeing a wedge pattern for this pair. So far, it is creating higher lows in the lower time frames (30 minutes,1 and 4 hour). As long as it holds this area around 0.7010 where my green rectangle is, I would be leaning more towards it breaking out. However, if it breaks below that, then there's a likelihood of NZDUSD coming down to re-test the lows around 0.6900.
We'll see next week and good luck trading!
We'll see next week and good luck trading!
風險提示:本文所述僅代表作者個人觀點,不代表 Followme 的官方立場。Followme 不對內容的準確性、完整性或可靠性作出任何保證,對於基於該內容所採取的任何行為,不承擔任何責任,除非另有書面明確說明。
喜歡的話,讚賞支持一下
 暫無留言。 來發表第一則觀點吧。