


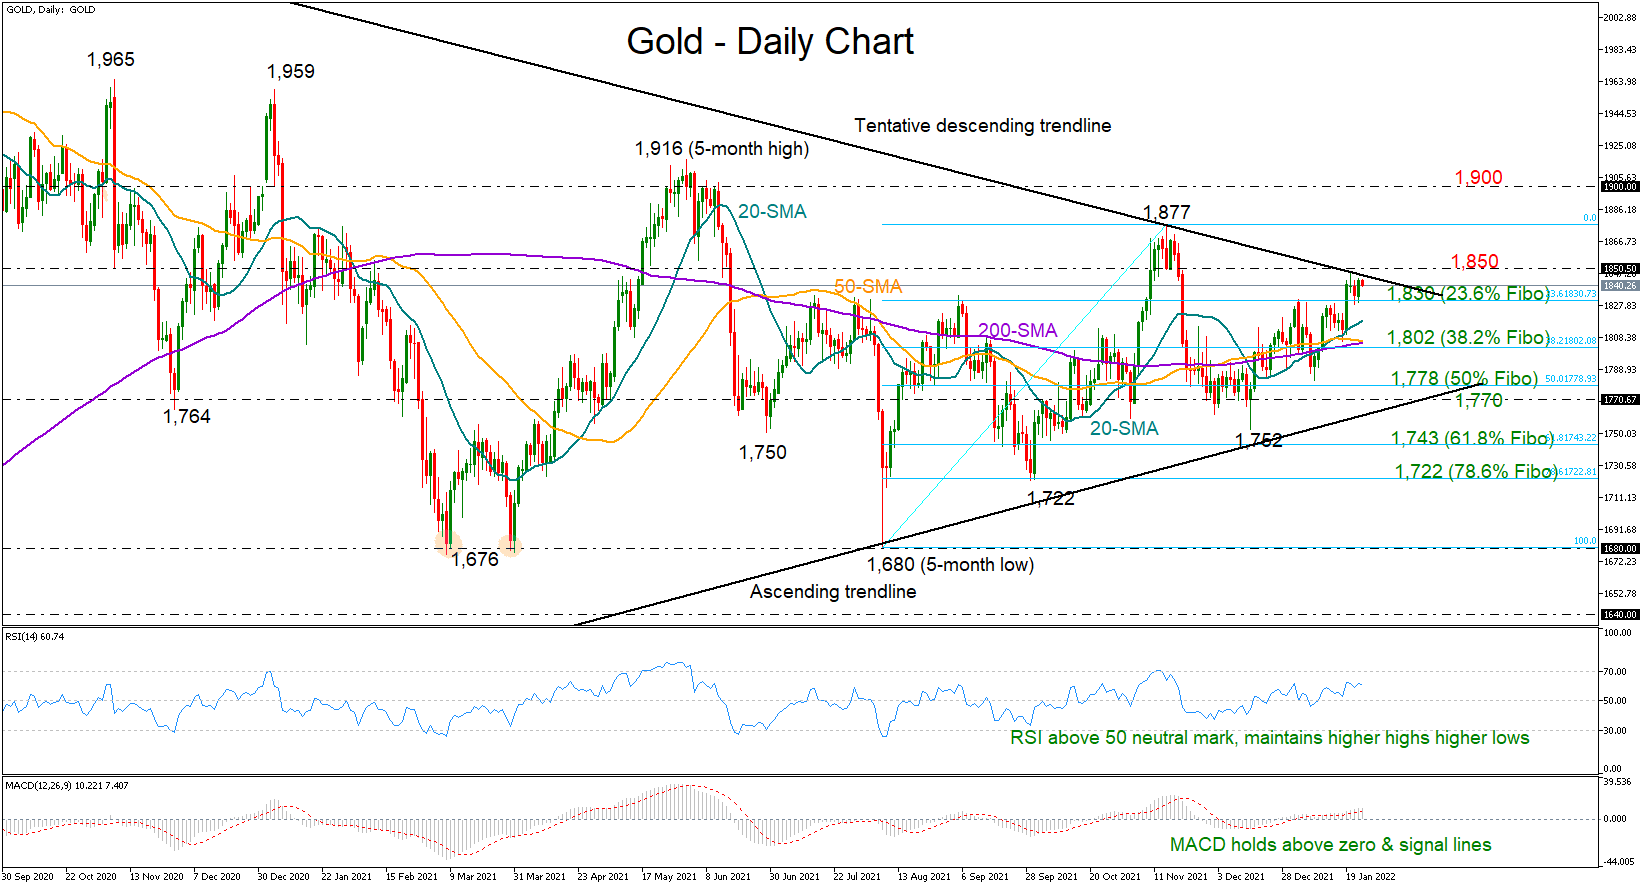
Gold shifted the spotlight to the descending trendline, which is connecting the all-time high of 2,079 from August 2020 with November’s 2021 peak of 1,877, following the break above the tough 1,830 ceiling.
The recent bullish double cross between the 20-day simple moving average (SMA) and the longer-term SMAs is promoting further progress in market trend, while the positive trajectory in the RSI and the MACD suggests an upside move in the price is more likely than a downside one.
Bullion, however, will need to successfully close above the resistance trendline and the 1,850 round-level to raise buying orders towards November’s top of 1,877. Running higher, the precious metal could face a critical test within the 1,900 – 1,916 region, a break of which would officially violate the long-term downtrend from the 2,079 record high, hopefully bringing the medium and long-term bulls into play as well.
Should the bearish scenario unfold, with the price pulling back below the 1,830 mark, the 20-day SMA could immediately attempt to block the way towards the 38.2% Fibonacci retracement of the 1,680 – 1,877 up leg at 1,800. Breaching the latter, the price will probably seek shelter around the 50% Fibonacci before it heads towards the long-term supportive trendline around 1,770. Failure to bounce here could see a more aggressive sell-off towards the 61.8% Fibonacci of 1,743.
In brief, Gold’s technical signals continue to flash green despite its latest stabilization, with buyers eagerly waiting for a sustainable move above the resistance trendline and the 1,850 number to further raise exposure in the market.
風險提示:本文所述僅代表作者個人觀點,不代表 Followme 的官方立場。Followme 不對內容的準確性、完整性或可靠性作出任何保證,對於基於該內容所採取的任何行為,不承擔任何責任,除非另有書面明確說明。
 暫無留言。 來發表第一則觀點吧。