


Key Highlights
- Gold price is gaining pace above the $1,810 and $1,812 resistance levels.
- A connecting bullish trend line is forming with support near $1,807 on the 4-hours chart.
- EUR/USD started a downside correction from the 1.1480 zone.
- GBP/USD is consolidating below the 1.3600 resistance zone.
Gold Price Technical Analysis
After a strong decline, gold price found support near the $1,780 level against the US Dollar. The price started a fresh increase above the $1,788 and $1,800 resistance levels.
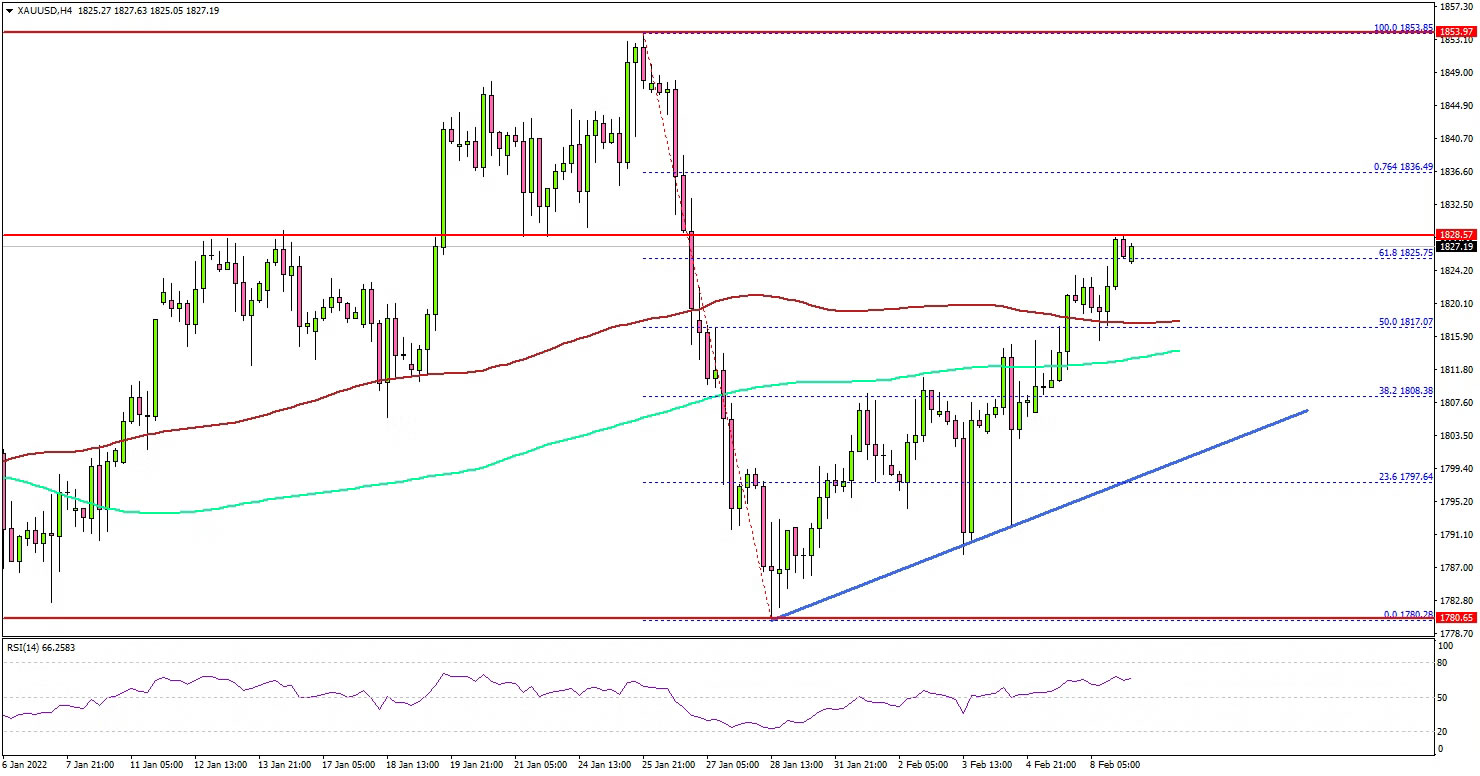
The 4-hours chart of XAU/USD indicates that the price was able to climb above the $1,810 resistance, the 100 simple moving average (red, 4-hours) and the 200 simple moving average (green, 4-hours).
There was a clear move above the 50% Fib retracement level of the downward move from the $1,853 swing high to $1,780 low. It is now facing resistance near the $1,828 and $1,830 levels. The next key resistance is near the $1,836 level.
It is near the 76.4% Fib retracement level of the downward move from the $1,853 swing high to $1,780 low. A clear move above the $1,836 level might send the price towards the $1,850 resistance zone.
If not, the price might correct lower and trade below the $1,812 level. The next major support is near $1,808 and a connecting bullish trend line on the same chart. Any more losses might send the price towards $1,780.
Looking at EUR/USD, the pair is showing a few negative signs below 1.1480 and 1.1450. Similarly, GBP/USD must surpass 1.3600 to continue higher in the near term.
Economic Releases to Watch Today
- US Wholesale Inventories for Dec 2021 – Forecast +2.1%, versus 2.1% previous.
風險提示:本文所述僅代表作者個人觀點,不代表 Followme 的官方立場。Followme 不對內容的準確性、完整性或可靠性作出任何保證,對於基於該內容所採取的任何行為,不承擔任何責任,除非另有書面明確說明。
 暫無留言。 來發表第一則觀點吧。