


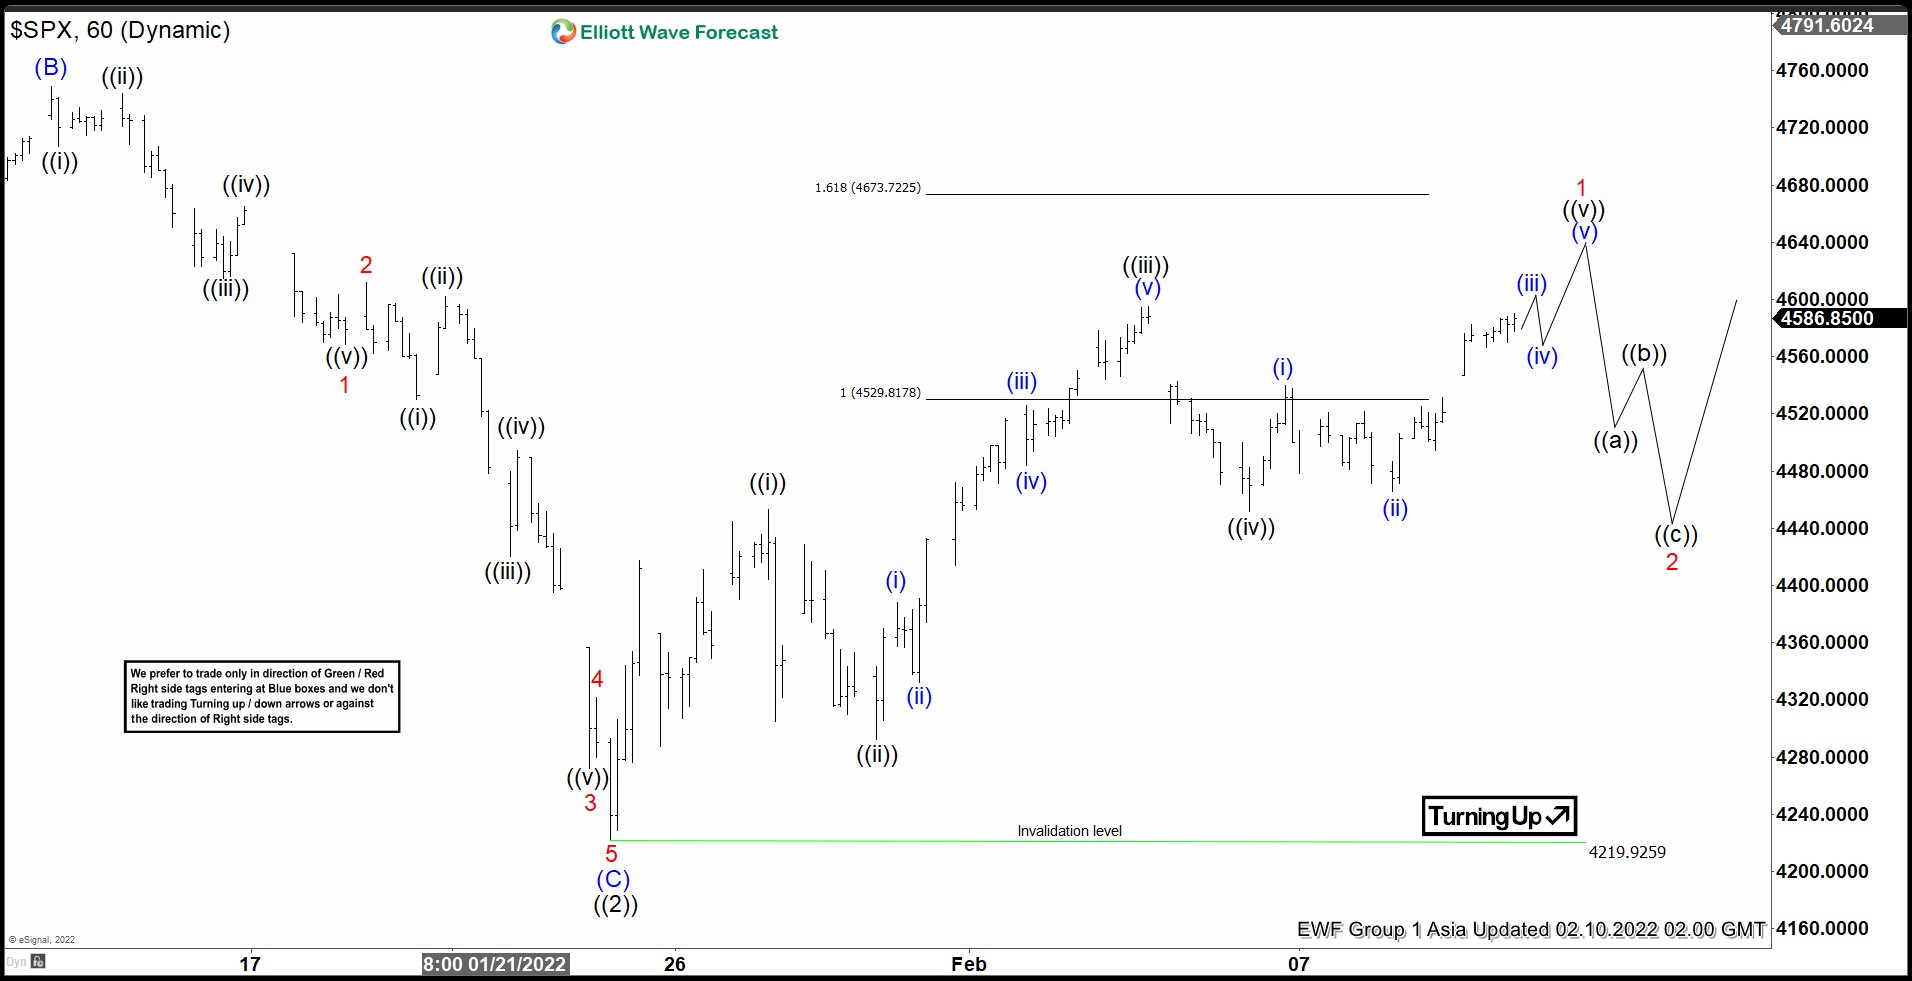
The short-term Elliott wave view in S&P500 (SPX) shows that we are looking for more upside to complete a 5 waves impulse structure, before see at least 3 swings pullback. The impulse move started from 4219 low to end wave ((i)) at 4453. A pullback in wave ((ii)) ended at 4292 low. SPX then resumes higher in wave ((iii)) with internal subdivision as another impulse in a lesser degree. Up from wave ((ii)), wave (i) ended at 4387, dips in wave (ii) ended at 4332, wave (iii) rallied to 4525 and a pullback appeared as wave (iv) ended at 4483. The last push higher to finish wave (v) ended at 4595. This completed wave ((iii)) in a higher degree.
Wave ((iv)) pullback ended at 4451. This level entered into the territory of wave ((i)) high which suggested a leading diagonal structure. Then the rally continued and we expect 5 waves up to finish wave ((v)) and wave 1. We could see already 3 waves up from wave ((iv)) low and we need 2 more waves complete the leading diagonal. The possible place to end this wave 1 comes in 4629 – 4684 area where we could find profit taking to begin a correction in 3, 7, or 11 swings. The view is valid as long as we stay above 4219.
S&P500 (SPX) 1 Hour Elliott Wave Chart
風險提示:本文所述僅代表作者個人觀點,不代表 Followme 的官方立場。Followme 不對內容的準確性、完整性或可靠性作出任何保證,對於基於該內容所採取的任何行為,不承擔任何責任,除非另有書面明確說明。
 暫無留言。 來發表第一則觀點吧。