


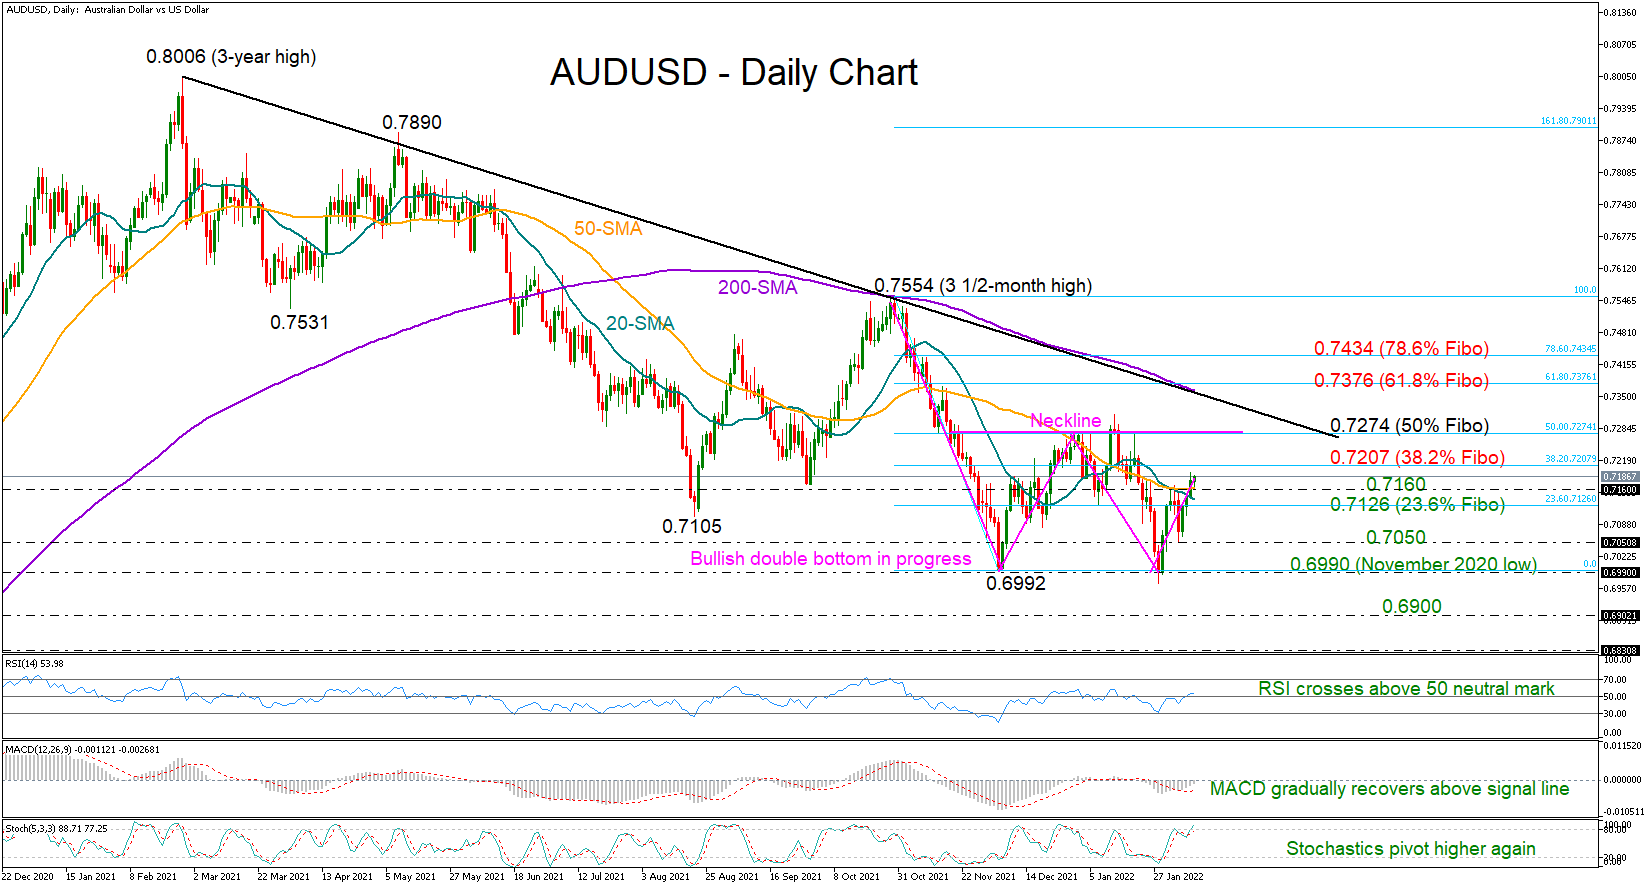
AUDUSD is in the second consecutive week of gains around 0.7180, having marginally surpassed its shorter-term simple moving averages (SMA), which had been controlling bullish forces more vitally since mid-January onwards. Notably, the pair has also overcome the restrictive 200-SMA in the weekly chart.
Of course, the soft bullish breakout still requires confirmation, but with the RSI rising above its 50 neutral mark, the MACD recovering above its red signal line, and the Stochastics pivoting northwards again, the current positive momentum in the price could further grow in the coming sessions.
Additional upside movements could initially get congested around the 0.7200 psychological mark, which overlaps with the 38.2% Fibonacci retracement of the 0.7554 – 0.6992 downleg. A step above this boundary would not bring new buyers into the market unless the recovery extends above the 50% Fibonacci of 0.7274. This area looks to be the neckline of a bullish double bottom pattern with a base at 0.6990. Hence, a significant violation at this point could trigger a more aggressive bullish wave, likely up to the crucial 200-day SMA at 0.7362.
In the bearish scenario, where the price slides back below 0.7160, the 23.6% Fibonacci of 0.7126 could immediately add some footing. Failure to bounce here could intensify selling pressures towards the 0.7050 handle, while deeper, it would be interesting to see whether the pair can ruin the bullish formation below the 0.6990 floor and run towards the 0.6900 number.
Summarizing, buying activity is expected to persist in the AUDUSD market, though only a rally above the 0.7274 bar could send meaningful directional signals.
風險提示:本文所述僅代表作者個人觀點,不代表 Followme 的官方立場。Followme 不對內容的準確性、完整性或可靠性作出任何保證,對於基於該內容所採取的任何行為,不承擔任何責任,除非另有書面明確說明。
 暫無留言。 來發表第一則觀點吧。