


Historically speaking, crude oil and the Canadian dollar have had a very strong relationship, most of the time, the two assets having a high degree of correlation.
This can be explained by the fact that Canada holds the second biggest oil reserves in the world after Saudi Arabia. Moreover, a large amount of these oil reserves are pumped into the United States, making Canada the biggest energy source for the U.S. economy. Thus, investors focus on crude oil prices to gauge the Cad’s direction of trading.
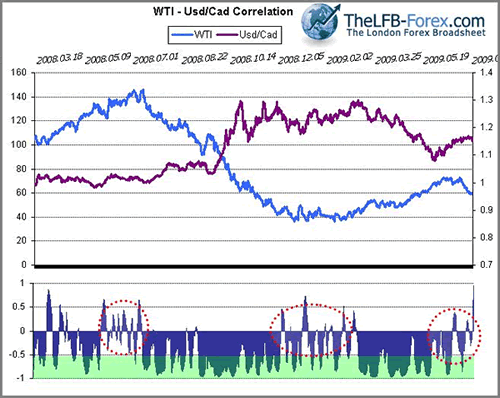
The correlation between crude oil and Cad was pretty easy to exploit in time, but all this came to an end over the last few weeks as crude oil began to quickly drop while the Canadian dollar declined only a few basis points throughout the same period. Most likely, this happened because of two different fundamental drivers: oil dropped as the market was re-pricing the outlook of the global demand, while Cad traded mostly range-bound, together with the dollar index and the other major currencies, as it seems the financial market saw more dollar than it would ever need (thus the market stayed in risk-aversion mode only for a short period).
The attached chart shows how the cad and crude oil have behaved over the last 15 months (from 03.01.2008 to 07.14.2009), while the secondary chart shows the weekly correlation between the two. The green area denotes the periods when the implied correlation was between -0.5 and -1.0, which are the phases when crude oil can be used to forecasts Cad’s direction. As a note, the extended periods when Crude oil and Cad had no correlation or moved in the same direction – as the one we have right now, denoted by the fact that the correlation index swings between -0.5 and 1.00- happened only when the market reversed the prior trend.
風險提示:本文所述僅代表作者個人觀點,不代表 Followme 的官方立場。Followme 不對內容的準確性、完整性或可靠性作出任何保證,對於基於該內容所採取的任何行為,不承擔任何責任,除非另有書面明確說明。
 暫無留言。 來發表第一則觀點吧。