


WEEKLY TECHNICAL OUTLOOK ON S&P500
SPX500 was, “attempting to break below key support into the close of the week at 4364/72- a region defined by the 61.8% Fibonacci retracement of the late-January recovery and the 52-week moving average.Weakness beyond this level threatens a new yearly low for the index with initial support seen at the 23.6% retracement of the entire 2019 rally at 4197- look for a larger reaction there IF reached.” SPX plunged lower the following week with the index briefly registering a low at 4104 before reversing sharply off a sliding parallel extending off the 2019 lows.
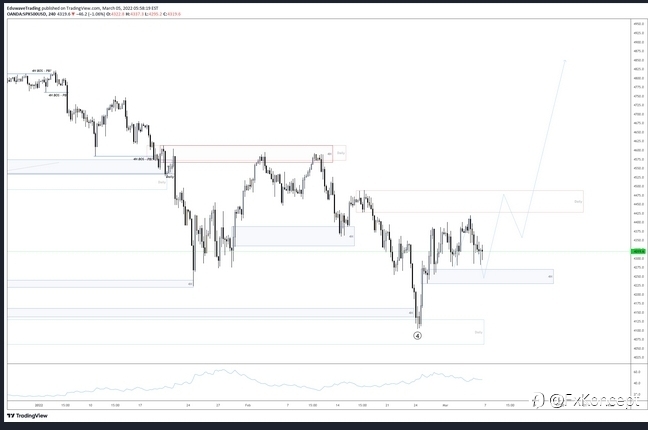
The rebound failed this week back a the 52-week moving average, putting initial resistance at 4392- a breach / close above this threshold is needed to shift the near-term focus higher towards the 61.8% Fibonacci retracement of 2022 range at 4547. Broader bearish invalidation steady at the yearly high-week close at 4677. Weekly support unchanged at 4197 backed by the 2019 trendline- a daily break / close below this slope would threaten another bout of accelerated losses towards key support at the May lows/ 100% extension of the yearly decline at 3993-4035.
SXP500 WEEKLY CHART VIEW
風險提示:本文所述僅代表作者個人觀點,不代表 Followme 的官方立場。Followme 不對內容的準確性、完整性或可靠性作出任何保證,對於基於該內容所採取的任何行為,不承擔任何責任,除非另有書面明確說明。
 暫無留言。 來發表第一則觀點吧。