


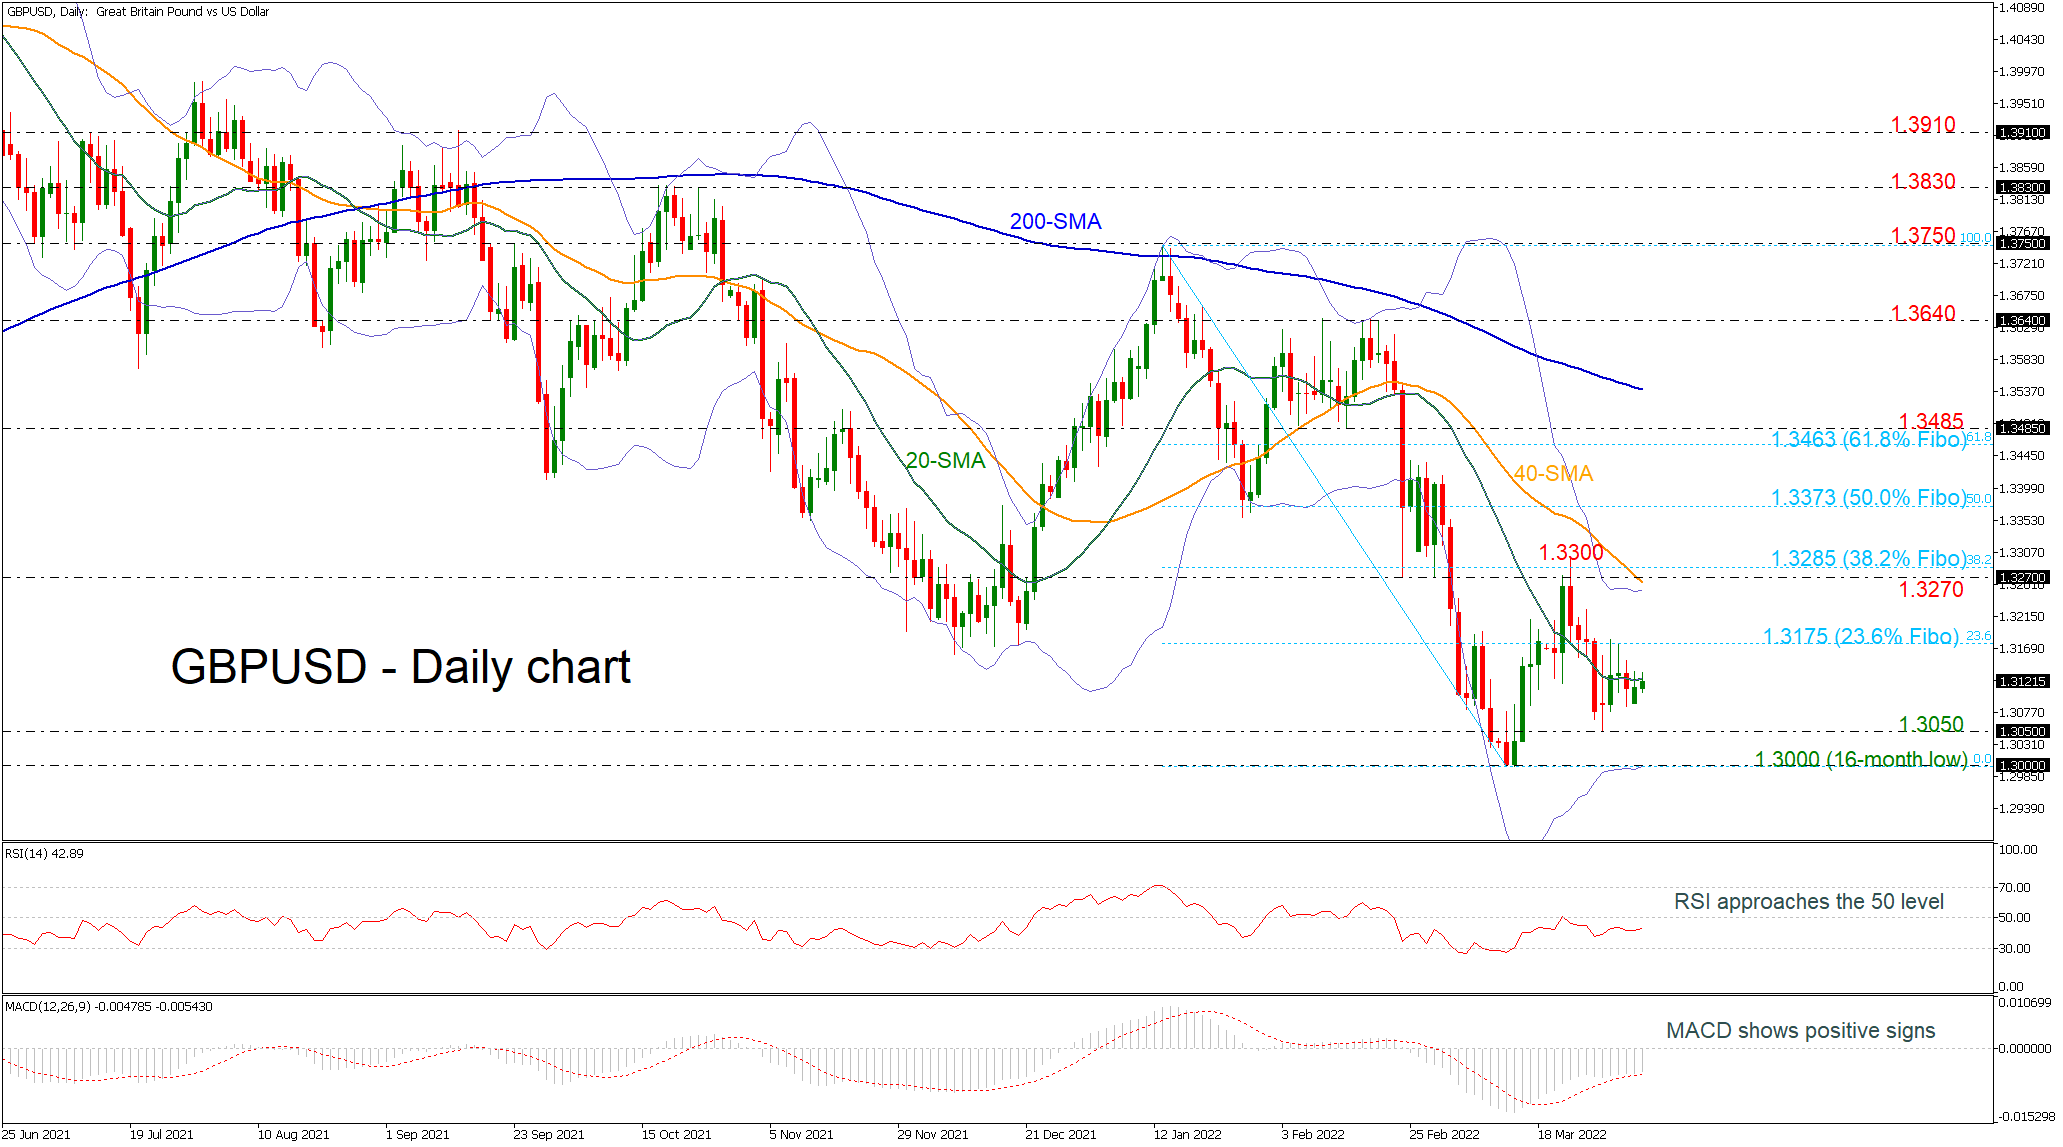
GBPUSD is developing near the 20-day simple moving average (SMA) and below the significant barrier of the 23.6% Fibonacci retracement level of the down leg from 1.3750 to 1.3000 at 1.3175. Over the last month, the price is looking neutral as it failed to post a lower low or a jump above the previous high near 1.3300.
The momentum indicators in the daily chart though are currently supporting that positive momentum is likely to strengthen in the short-term. Specifically, the RSI is picking up speed above 50 and the MACD continues to move above its red signal line in the negative region.
Should the price decisively close above the roof of the 23.6% Fibonacci of 1.3175, bulls could extend an upward move towards the crucial area of the 1.3270 resistance, which holds near the upper Bollinger band and the 40-day SMA. Slightly higher, the 38.2% Fibonacci of 1.3285 may halt the bullish movements ahead of the previous high of 1.3300. Further advances above this level, could then target the area around the 50.0% Fibonacci of 1.3373.
On the other hand, a decline could meet the 1.3050 support, which the market was unable to break through from the end of March. Even lower, the price could retest the 16-month low of 1.3000, which overlaps with the lower Bollinger band, before more bearish movement shifts the focus to the 1.2850 barrier, taken from the low in November 2020.
Summarizing, GBPUSD has been in a declining mode since May 2021 and only a surge above the 200-day SMA around 1.3540 may switch the bearish outlook to bullish.
風險提示:本文所述僅代表作者個人觀點,不代表 Followme 的官方立場。Followme 不對內容的準確性、完整性或可靠性作出任何保證,對於基於該內容所採取的任何行為,不承擔任何責任,除非另有書面明確說明。
 暫無留言。 來發表第一則觀點吧。