


· 閱讀量 1,234
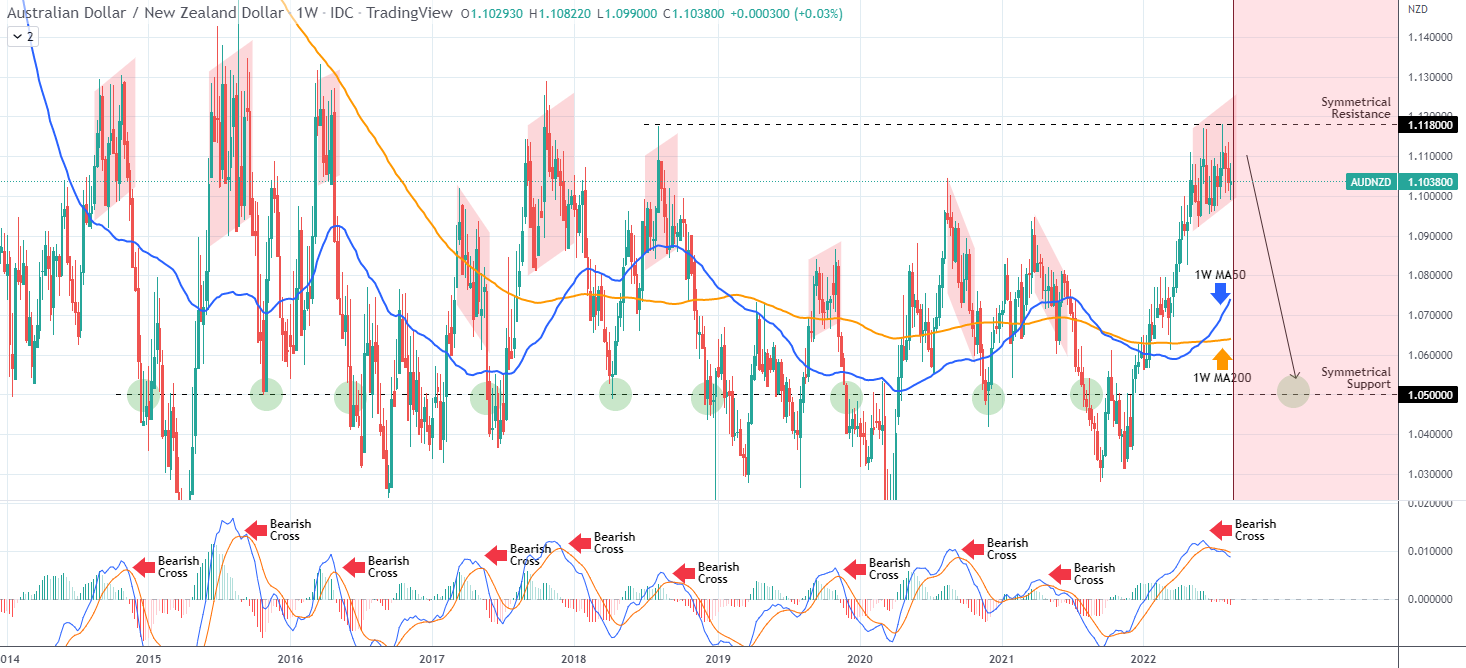
The AUDNZD pair is trading within a Channel Up since the start of May but has most likely peaked based on this unique pattern going back 8 years.
The chart is on the 1W time-frame where the MACD is trading downwards after a late June Bearish Cross. As you see, every such Bearish Cross above the 0.0 MACD level, formed a long-term Top on either a Channel Up or Down pattern since 2014. All the downtrends that followed this peak formation were sharp sell-offs that dropped to at least the 1.0500 level (symmetrical Support) even though most reached a lot lower.
As a result since we are still inside the Channel Up pattern, this could be the best place for a sell position this year. You can use three target levels: the 1W MA50 (blue trend-line) short-term, the 1W MA200 (orange trend-line) medium-term and the 1.0500 Symmetrical Support for the long-term. #OPINIONLEADER#
風險提示:本文所述僅代表作者個人觀點,不代表 Followme 的官方立場。Followme 不對內容的準確性、完整性或可靠性作出任何保證,對於基於該內容所採取的任何行為,不承擔任何責任,除非另有書面明確說明。
喜歡的話,讚賞支持一下
 暫無留言。 來發表第一則觀點吧。