


| Scenario | |
|---|---|
| Timeframe | Weekly |
| Recommendation | SELL STOP |
| Entry Point | 137.50 |
| Take Profit | 130.95, 126.25 |
| Stop Loss | 139.24 |
| Key Levels | 126.25, 130.95, 137.50, 141.11, 146.03, 151.82 |
| Alternative scenario | |
|---|---|
| Recommendation | BUY STOP |
| Entry Point | 141.15 |
| Take Profit | 146.03, 151.82 |
| Stop Loss | 139.24 |
| Key Levels | 126.25, 130.95, 137.50, 141.11, 146.03, 151.82 |
USD/JPY, H4
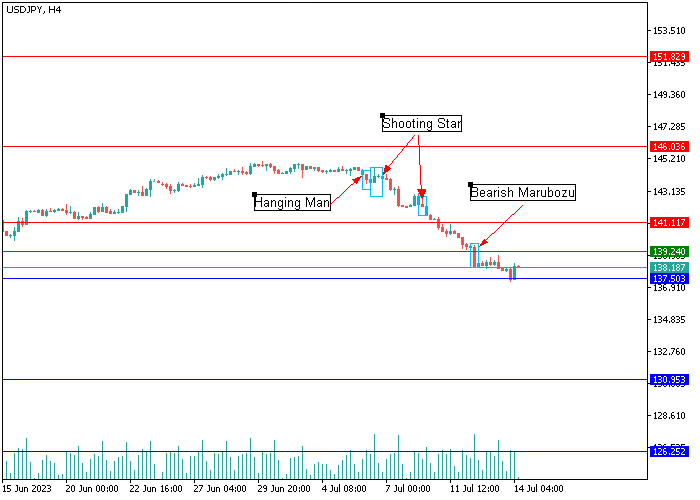
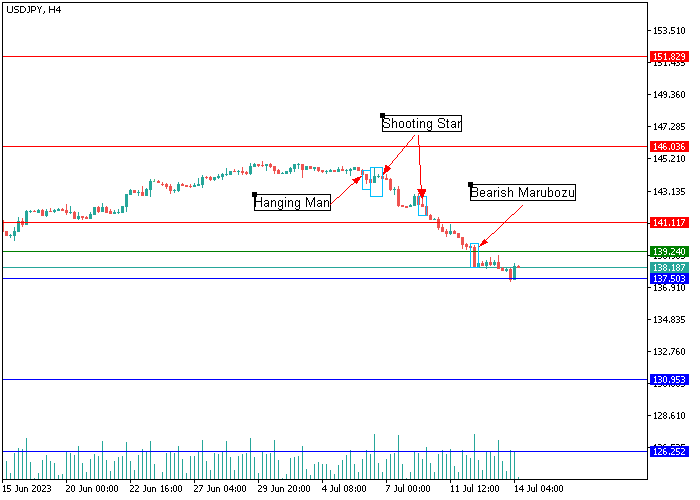
On the four-hour timeframe, a Hammer candlestick analysis pattern formed around 146.03, and a series of Shooting Star patterns appeared around resistance level 141.11, which signals a trend reversal. At the moment, the quotes are consolidating near the support level of 137.50, forming a “bearish” Marubozu pattern, and, most likely, they will maintain a negative trend: consolidation of the price below 137.50 will allow it to continue moving towards the area of 130.95–126.25. In case of a reversal and consolidation above the resistance level 141.11, growth may develop into the zone 146.03–151.82.
USD/JPY, D1
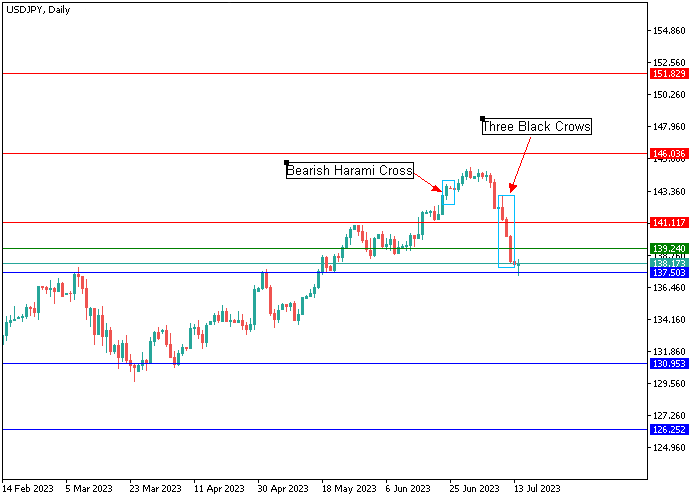
On the daily chart below 146.03, there is a “bearish” Harami Cross candlestick pattern, after the formation of which the quotes reversed downwards, and around 141.11 there is a Three Black Crows pattern, emphasizing the strength of the “bears” and signaling a continuation of the downward dynamics to 137.50, overcoming which will be a signal to open short positions with the target at 130.95–126.25.
Support and resistance
Resistance levels: 141.11, 146.03, 151.82.
Support levels: 137.50, 130.95, 126.25.
Trading tips
Short positions may be opened below 137.50 with the targets at 130.95 and 126.25. Stop loss – 139.24. Implementation period: 9–12 days.
Long positions may be opened above 141.11 with the targets at 146.03 and 151.82. Stop loss – 139.24.
風險提示:本文所述僅代表作者個人觀點,不代表 Followme 的官方立場。Followme 不對內容的準確性、完整性或可靠性作出任何保證,對於基於該內容所採取的任何行為,不承擔任何責任,除非另有書面明確說明。
 暫無留言。 來發表第一則觀點吧。