


| Scenario | |
|---|---|
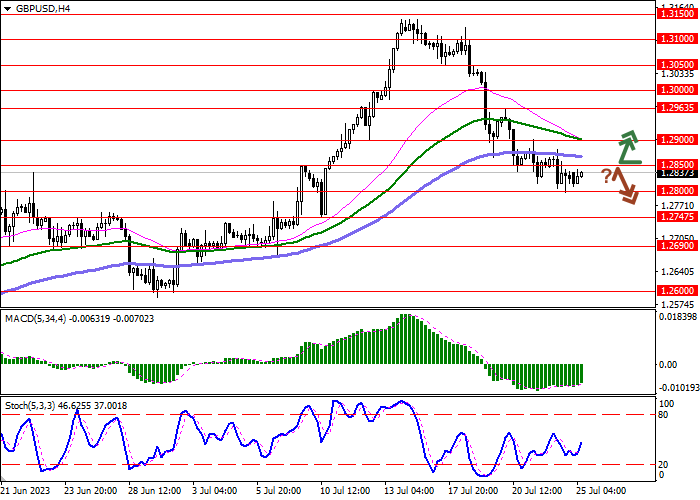
| Timeframe | Intraday |
| Recommendation | BUY STOP |
| Entry Point | 1.2850 |
| Take Profit | 1.2963 |
| Stop Loss | 1.2800 |
| Key Levels | 1.2600, 1.2690, 1.2747, 1.2800, 1.2850, 1.2900, 1.2963, 1.3000 |
| Alternative scenario | |
|---|---|
| Recommendation | SELL STOP |
| Entry Point | 1.2800 |
| Take Profit | 1.2690 |
| Stop Loss | 1.2850 |
| Key Levels | 1.2600, 1.2690, 1.2747, 1.2800, 1.2850, 1.2900, 1.2963, 1.3000 |
Current trend
The GBP/USD pair shows a multidirectional nature of trading, holding near 1.2830. The American currency is actively adding in value, receiving support from the expectations of the tightening of the monetary policy of the US Federal Reserve at the meeting, the results of which will be known tomorrow.
Some analysts are convinced that the July interest rate hike could be the last in the current long cycle of monetary tightening. The regulator will try to take a wait-and-see attitude, after which it may return to lower borrowing costs in early 2024, which will depend on the real situation in the economy. In turn, the meeting of the Bank of England will be held next week. The British regulator is also expected to adjust the indicator at a minimal pace (by 25 basis points), given the continuing inflationary pressure in the country. Despite the correction in the Consumer Price Index in the UK, EY Item Club analysts are confident that in the future the dynamics will slow down at a slower pace than originally expected, due to the continued high cost of food and energy. Inflation is forecast to average 7.6% this year, compared to 6.2% forecast in April, putting even more pressure on households. On the other hand, annual wage growth is not expected to outpace price increases until 2025.
Macroeconomic data from the UK, published the day before, did not provide any support to the pound. The Manufacturing PMI from S&P Global in July fell from 46.5 points to 45.0 points, while the forecast was 46.1 points, the Services PMI went down from 53.7 points to 51.5 points, which also turned out to be worse than the 53.0 points expected by analysts, and the Composite PMI declined from 52.8 points to 50.7 points, while experts expected 52.4 points.
Support and resistance
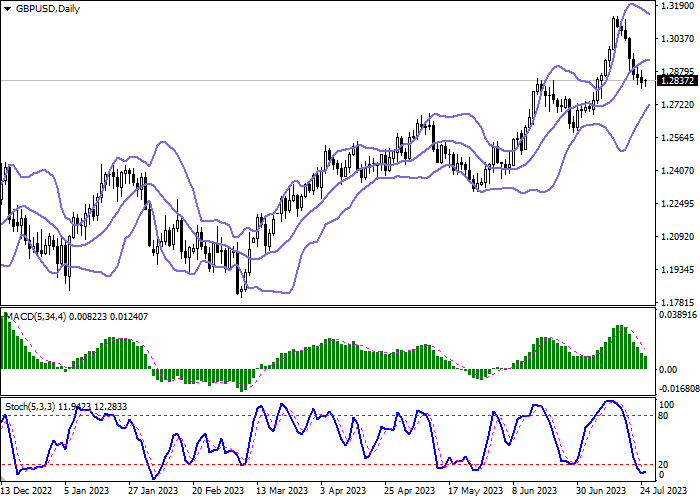
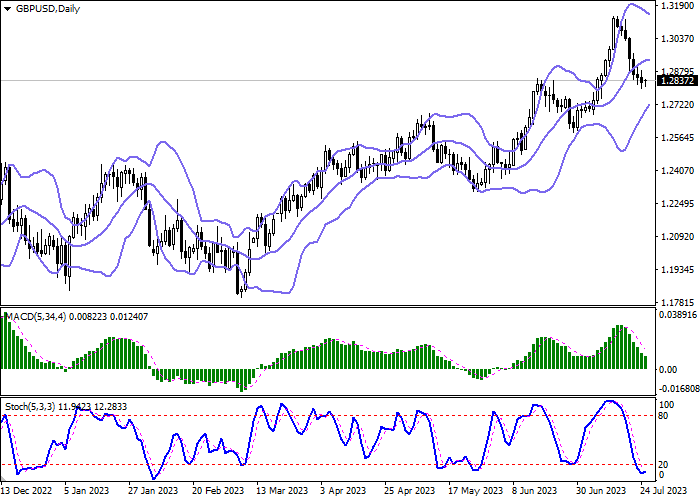
In the D1 chart, Bollinger Bands are reversing horizontally. The price range is narrowing, reflecting the emergence of ambiguous dynamics of trading in the middle term. MACD is going down preserving a stable sell signal (located below the signal line). Stochastic, approaching its lows, is trying to reverse upwards, signaling in favor of the development of corrective growth in the near future.
Resistance levels: 1.2850, 1.2900, 1.2963, 1.3000.
Support levels: 1.2800, 1.2747, 1.2690, 1.2600.
Trading tips
Long positions can be opened after a breakout of 1.2850 with the target of 1.2963. Stop-loss — 1.2800. Implementation time: 2-3 days.
A rebound from 1.2850 as from resistance, followed by a breakdown of 1.2800 may become a signal for opening of new short positions with the target at 1.2690. Stop-loss — 1.2850.
風險提示:本文所述僅代表作者個人觀點,不代表 Followme 的官方立場。Followme 不對內容的準確性、完整性或可靠性作出任何保證,對於基於該內容所採取的任何行為,不承擔任何責任,除非另有書面明確說明。
 暫無留言。 來發表第一則觀點吧。