


| Scenario | |
|---|---|
| Timeframe | Weekly |
| Recommendation | BUY STOP |
| Entry Point | 80.55 |
| Take Profit | 86.00 |
| Stop Loss | 78.00 |
| Key Levels | 72.40, 77.10, 80.50, 86.00 |
| Alternative scenario | |
|---|---|
| Recommendation | SELL STOP |
| Entry Point | 77.05 |
| Take Profit | 72.40 |
| Stop Loss | 79.00 |
| Key Levels | 72.40, 77.10, 80.50, 86.00 |
Current trend
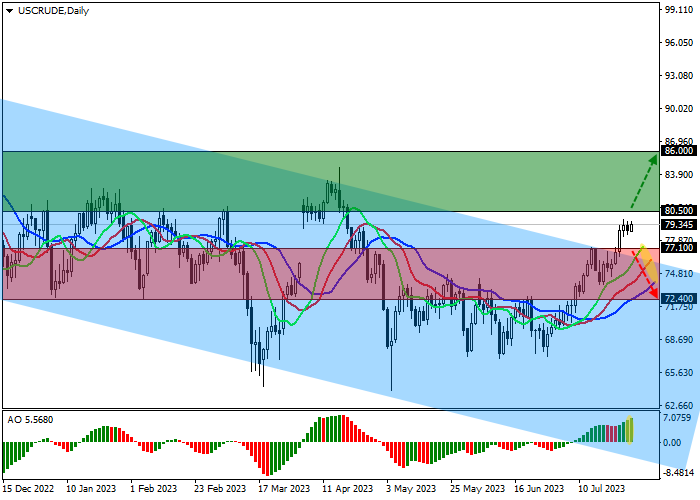
The price of North American WTI Crude Oil is correcting in a lateral trend around 79.35.
Quotations of "black gold" on world markets continue to rise, which is facilitated by both measures to reduce production by OPEC countries and the increasing integration of Russian Urals oil into the share of world supplies. For the first time since the introduction of a price limit of 60.0 dollars per barrel for oil from the Russian Federation by Western countries, the cost of Urals exceeded 65.0 dollars per barrel. Russia is increasing oil exports to Asian and African countries: in the first five months of 2023, the supply of Russian "black gold" to Africa more than tripled, amounting to a record 8.0 million tons.
Against this background, the levels of oil reserves are also stabilizing. Thus, according to the American Petroleum Institute (API), the volume of oil in US storage facilities increased by 1.319 million barrels, which is significantly higher than the reduction of 1.969 million barrels, which was predicted by analysts. In turn, the Energy Information Administration (EIA) of the US Department of Energy reported a reduction in inventories of only 0.600 million barrels after a decrease of 2.348 million barrels a week earlier. In addition, the volume of imports of "black gold" in the United States decreased by 1.584 million barrels after -0.376 million barrels a week earlier.
Support and resistance
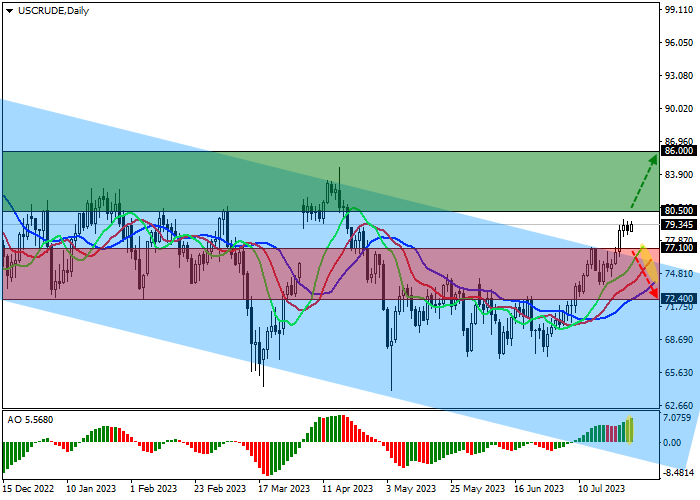
On the daily chart, the price continues to try to leave the global channel with dynamic boundaries 62.00-77.00, holding above the resistance line.
Technical indicators continue rising, holding a steady buy signal: the fast EMAs on the Alligator indicator keep the fluctuation range directed upwards, and the AO histogram is forming new ascending bars, rising in the buying zone.
Support levels: 77.10, 72.40.
Resistance levels: 80.50, 86.00.
Trading tips
If the asset continues developing local corrective growth and the price consolidates above the local resistance level of 80.50, long positions will be relevant with target at 86.00. Stop-loss — 78.00. Implementation time: 7 days and more.
If the asset continues local decline and the price consolidates below the local support level at 77.10, short positions can be opened with the target at 72.40. Stop-loss — 79.00.
風險提示:本文所述僅代表作者個人觀點,不代表 Followme 的官方立場。Followme 不對內容的準確性、完整性或可靠性作出任何保證,對於基於該內容所採取的任何行為,不承擔任何責任,除非另有書面明確說明。
 暫無留言。 來發表第一則觀點吧。