Hello Traders! Today, we will look at the Monthly and Weekly Elliott Wave structure of Enbridge Inc. ($ENB) and explain why the stock is at a Generational low and a Multi Year Rally should happen soon.
Enbridge Inc. is a multinational pipeline and energy company headquartered in Calgary, Alberta, Canada. Enbridge owns and operates pipelines throughout Canada and the United States, transporting crude oil, natural gas, and natural gas liquids. Enbridge's pipeline system is the longest in North America and the largest oil export pipeline network in the world.
$ENB Monthly Elliott Wave View July 31 2023:
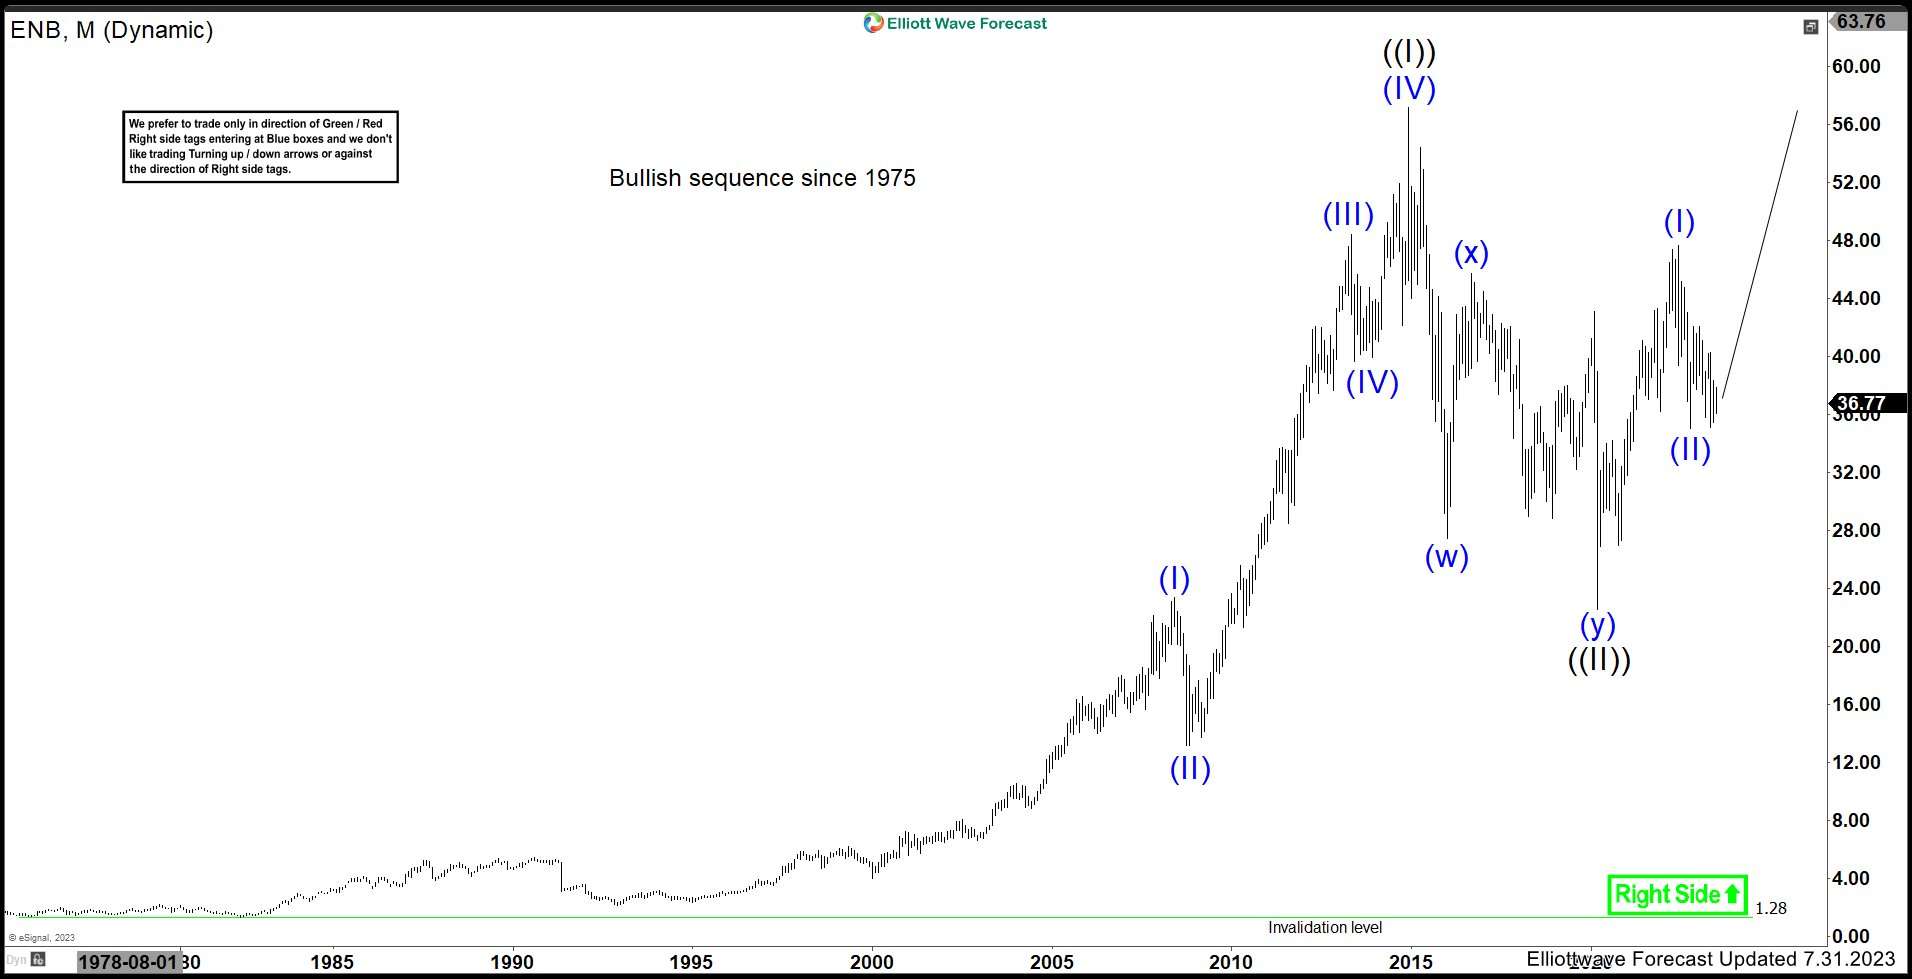
The Monthly chart above shows the Grand super cycle from Jan 1975 low unfold in a 5 wave impulsive structure suggesting a bullish sequence. The rally peaked on Dec 2014 and started the pullback to correct the entire cycle. The pullback unfolded in a corrective structure (WXY) and found buyers on March 2020.
$ENB Weekly Elliott Wave View July 31 2023:
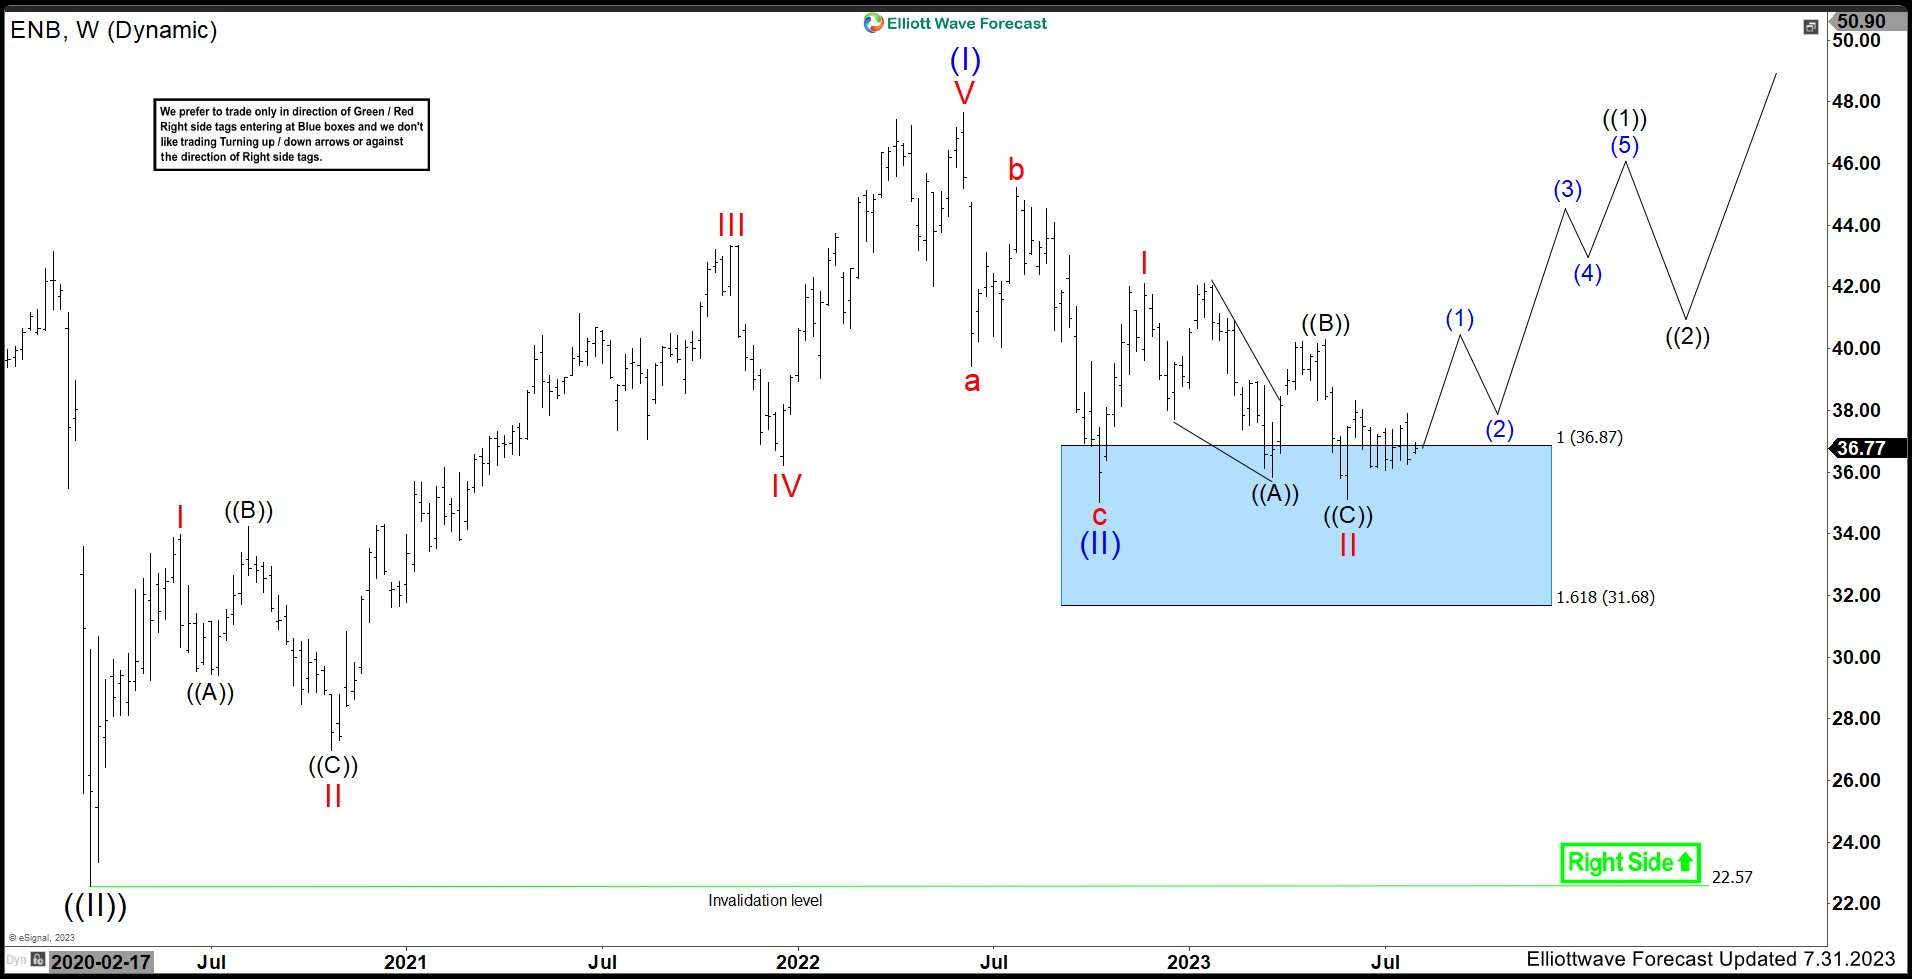
The Weekly chart above shows the cycle from March 2020 also unfold in a 5 wave impulsive structure suggesting another bullish sequence. The rally peaked on June 2022 and started a pullback to correct it. The pullback also unfolded in a corrective structure (ABC) and has entered our Blue Box area (36.87 - 31.68) where buyers are expected to appear soon.
We have a bullish sequence against March 2020 lows. As long as price remains above the invalidation level at $22.57, $ENB is expected to rally soon. Remember, corrections run in 3, 7 or 11 swings, so risk management should be exercised. The market could bounce and end up doing 7 swings lower before higher so we like to book partial profits and get risk free once the bounce takes place from the blue box.
風險提示:本文所述僅代表作者個人觀點,不代表 Followme 的官方立場。Followme 不對內容的準確性、完整性或可靠性作出任何保證,對於基於該內容所採取的任何行為,不承擔任何責任,除非另有書面明確說明。

暫無評論,立馬搶沙發