| Scenario | |
|---|---|
| Timeframe | Weekly |
| Recommendation | SELL STOP |
| Entry Point | 0.6058 |
| Take Profit | 0.5875, 0.5690 |
| Stop Loss | 0.6118 |
| Key Levels | 0.5690, 0.5875, 0.6058, 0.6253, 0.6420, 0.6564 |
| Alternative scenario | |
|---|---|
| Recommendation | BUY STOP |
| Entry Point | 0.6255 |
| Take Profit | 0.6420, 0.6564 |
| Stop Loss | 0.6193 |
| Key Levels | 0.5690, 0.5875, 0.6058, 0.6253, 0.6420, 0.6564 |
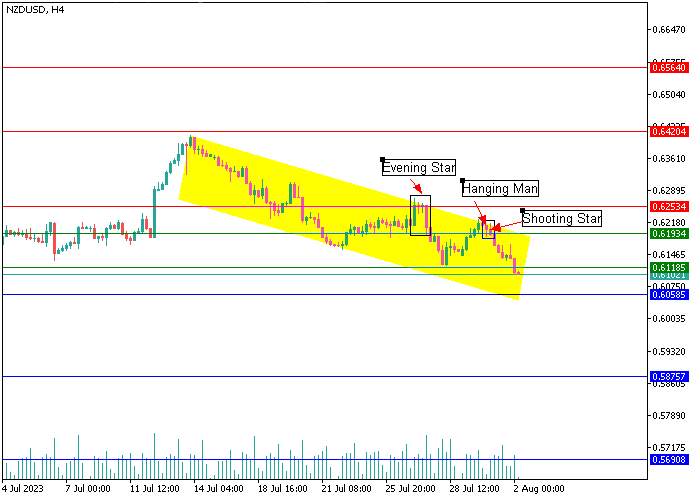
NZD/USD, H4
On the four-hour chart, there is a downtrend from the level of 0.6420, and in the area of the resistance level of 0.6253, an Evening Star candlestick analysis pattern has formed, which signals a price reversal and confirms the transition of the initiative to the "bears". Besides, at the level of 0.6193 two reversal patterns, Hanging Man and Shooting Star, have formed. At the moment, the instrument is trading near the key support level 0.6058, cosolidation below which will allow sellers to direct the price to the area of 0.5875–0.5690. An alternative scenario is possible in case of a rebound from the level of 0.6058 after the development of the upward dynamics and the price consolidating above the resistance level of 0.6253; then one should expect the restoration of lost positions to the zone of 0.6420–0.6564.

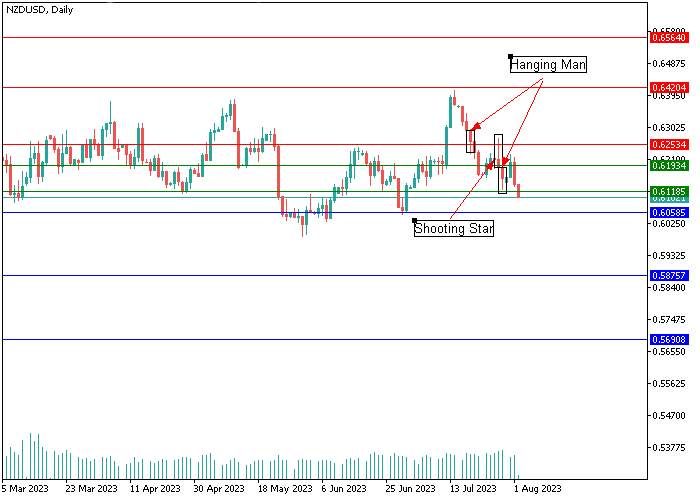
NZD/USD, D1
On the daily chart, in the range of 0.6118–0.6253, a series of Hanging Man and Shooting Star reversal candlestick patterns formed. The negative dynamics in the asset is developing rapidly, and in case of a breakdown of the support level of 0.6058, the movement will continue to the level of 0.5690.
Support and resistance
Support levels: 0.6058, 0.5875, 0.5690.
Resistance levels: 0.6253, 0.6420, 0.6564.
Trading tips
Short positions can be opened below 0.6058 with targets at 0.5875, 0.5690. Stop-loss — 0.6118. Implementation time: 9-12 days.
Long positions can be opened above 0.6253 with targets at 0.6420, 0.6564. Stop-loss — 0.6193.
風險提示:本文所述僅代表作者個人觀點,不代表 Followme 的官方立場。Followme 不對內容的準確性、完整性或可靠性作出任何保證,對於基於該內容所採取的任何行為,不承擔任何責任,除非另有書面明確說明。

暫無評論,立馬搶沙發