


| Scenario | |
|---|---|
| Timeframe | Weekly |
| Recommendation | SELL |
| Entry Point | 145.28 |
| Take Profit | 120.20, 115.30 |
| Stop Loss | 153.43 |
| Key Levels | 115.30, 120.20, 153.43, 160.00, 165.00 |
| Alternative scenario | |
|---|---|
| Recommendation | BUY STOP |
| Entry Point | 153.45 |
| Take Profit | 160.00, 165.00 |
| Stop Loss | 151.25 |
| Key Levels | 115.30, 120.20, 153.43, 160.00, 165.00 |
The probability of decline remains.
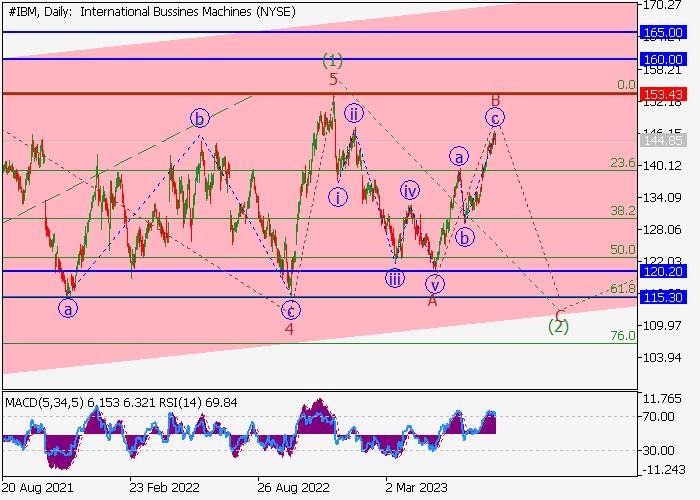
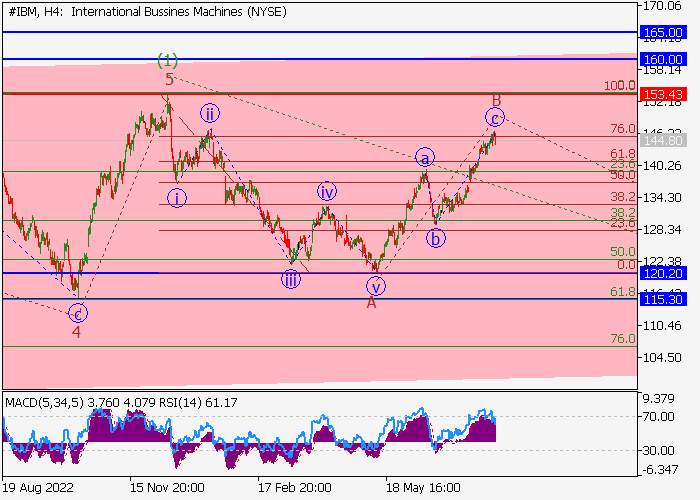
On the daily chart, the first wave of the higher level (1) of 5 has formed and a downward correction is developing as the second wave (2) of 5. At the moment, wave A of (2) and the upward corrective wave B of (2) have ended, in which wave c of B has appeared. If the assumption is correct, the price will drop to the area of 120.20–115.30. The level of 153.43 is critical and stop-loss for this scenario.
Main scenario
Short positions are relevant below the level of 153.43 with targets at 120.20–115.30. Implementation time: 7 days and more.
Alternative scenario
Breakout and consolidation of the price above 153.43 will allow the instrument to continue its uptrend to the area of 160.00–165.00.
風險提示:本文所述僅代表作者個人觀點,不代表 Followme 的官方立場。Followme 不對內容的準確性、完整性或可靠性作出任何保證,對於基於該內容所採取的任何行為,不承擔任何責任,除非另有書面明確說明。

暫無評論,立馬搶沙發