


| Scenario | |
|---|---|
| Timeframe | Weekly |
| Recommendation | SELL STOP |
| Entry Point | 21.93 |
| Take Profit | 20.50, 19.95 |
| Stop Loss | 22.70 |
| Key Levels | 19.95, 20.50, 21.95, 23.00, 23.70 |
| Alternative scenario | |
|---|---|
| Recommendation | SELL LIMIT |
| Entry Point | 23.70 |
| Take Profit | 20.50, 19.95 |
| Stop Loss | 24.30 |
| Key Levels | 19.95, 20.50, 21.95, 23.00, 23.70 |
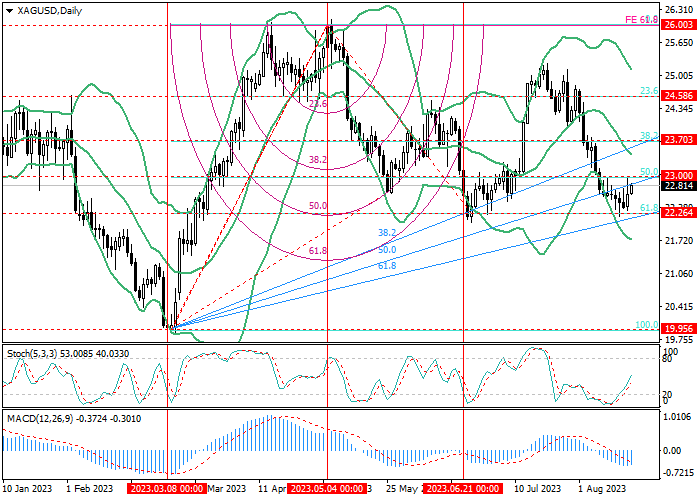
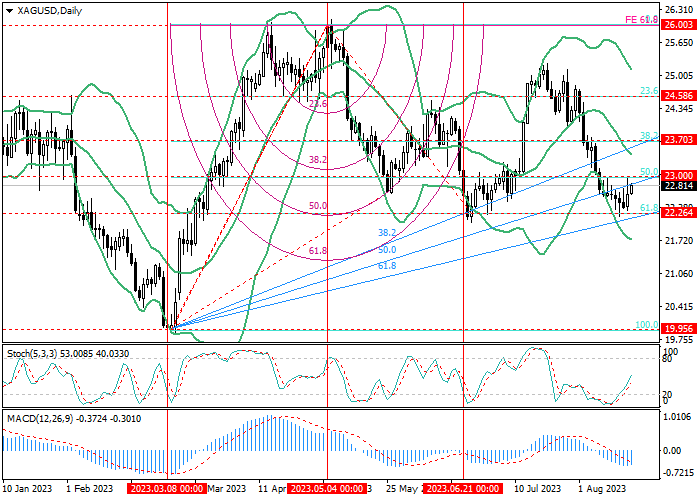
XAG/USD, D1
On the daily chart, the instrument tries to rise from 22.26 (correction 61.8%, rising fan line 61.8%), which it tried unsuccessfully to break last month. Now the price is close to 23.00 (correction 50.0%, ascending fan line 50.0%), the breakdown of which will allow the upward movement to reach the area of 23.70 (correction 38.2%, the middle line of Bollinger Bands) and 24.58 (correction 23.6 %). If it consolidates below 22.26, a correction to 19.95 is likely (correction 100.0%).
Technical indicators do not give a single signal: Bollinger bands are directed downwards, and the MACD histogram is increasing in the negative zone, confirming the preservation of the current trend but Stochastic has rushed up, not excluding the strengthening of the upward dynamics.
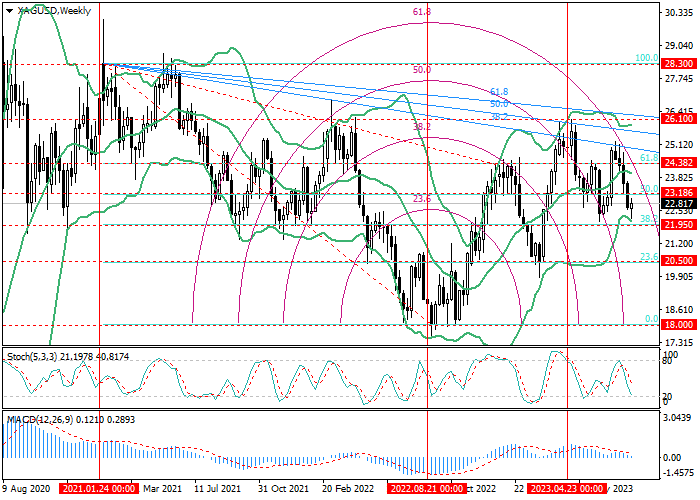
XAG/USD, W1
On the weekly chart, the price failed to break through the oncoming downward fan and resumed its decline, approaching 21.95 (correction 38.2%), the breakdown of which will be the catalyst for moving towards 20.50 (correction 23.6%). If 23.18 (correction 50.0%) is broken upwards, growth will resume to 24.38 (correction 61.8%).
Technical indicators do not give a single signal: Bollinger bands reverse horizontally, Stochastic is pointing downwards, and the MACD histogram is preparing to go into the negative zone and form a sell signal.
Support and resistance
If the support zone 22.26–21.95 (correction 61.8%, D1 and correction 38.2%, W1) is broken down, the targets for the decline will be 20.50 (correction 23.6%, W1) and 19.95 (correction 100.0%, D1). Continuation of corrective growth to the area of 23.70 (correction 38.2%, the middle line of Bollinger bands, D1) is also not excluded but it is unlikely to lead to a change in the current trend.
Resistance levels: 23.00, 23.70.
Support levels: 21.95, 20.50, 19.95.
Trading tips
Short positions should be opened below 21.95 or when the price reverses at 23.70 with the targets at 20.50, 19.95, and stop losses at 22.70 and 24.30, respectively. Implementation period: 5–7 days.
風險提示:本文所述僅代表作者個人觀點,不代表 Followme 的官方立場。Followme 不對內容的準確性、完整性或可靠性作出任何保證,對於基於該內容所採取的任何行為,不承擔任何責任,除非另有書面明確說明。
 暫無留言。 來發表第一則觀點吧。