


In our previous blog, we said that Gold-to-Silver ratio has resumed to the downside. In this article and video today, we will update the Elliott Wave outlook of the ratio. It's been pretty sideways in the last few months, but it is likely to break sooner or later. To refresh, when the ratio goes lower, the price of both the underlying metals (Gold and Silver) will go up. Silver will outperform Gold both to the upside and downside. When the ratio goes lower, the price of Silver will go higher faster and outrun Gold.
Gold-to-Silver (AUG) Daily Elliott Wave Chart
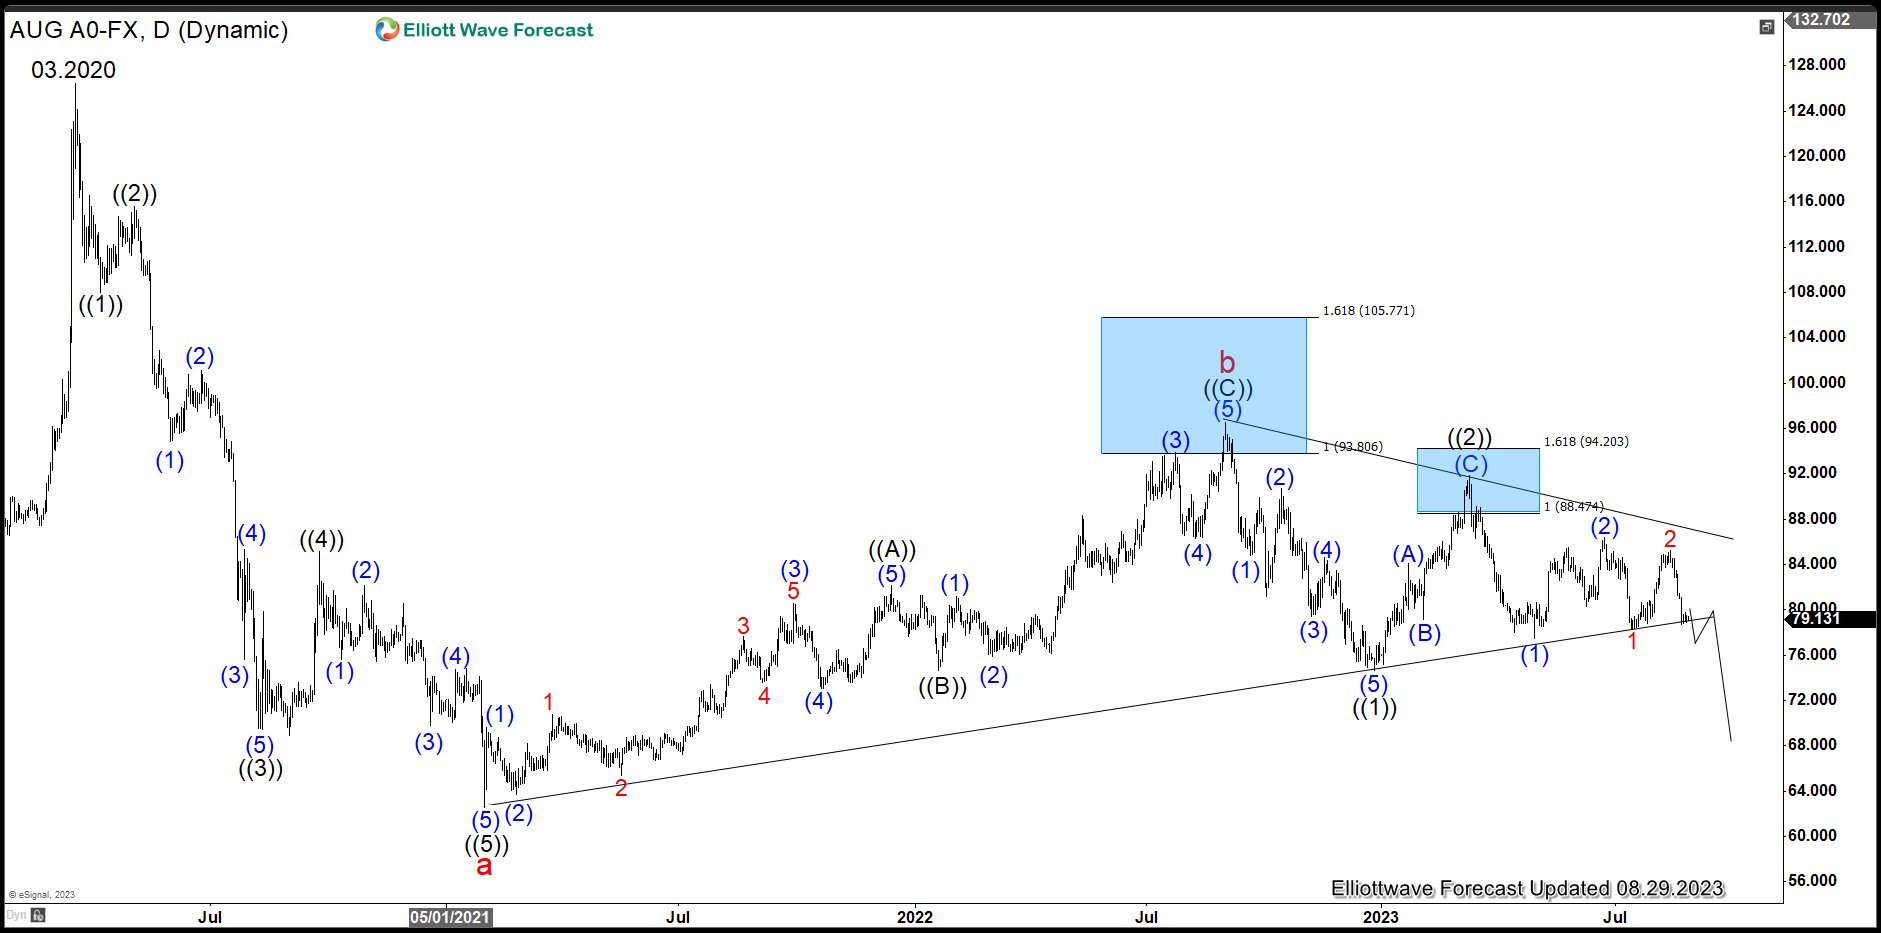 Daily Elliott Wave Chart of Gold-to-Silver ratio above shows that the ratio has been trading sideways in the past few months. The top on March 2020 was a capitulation move during the Covid 19 scare. Since then the ratio moved lower as a 5 waves impulse ending wave a at 62.51. It then rallied higher in a 3 waves zigzag ending wave b at 96.58. The ratio has since turned lower but it has not broken below wave a and continued to trade sideways until now. We are looking for a breakout soon. If we can close below the ascending trend line from wave a, as well as breaking below previous wave 1 at 78.33, that will signal the next leg lower in the ratio has started. That will also mean both Gold and Silver price will rally. We should expect the price of gold and silver to continue higher in the second half of 2023 as the ratio breaks lower.
風險提示:本文所述僅代表作者個人觀點,不代表 Followme 的官方立場。Followme 不對內容的準確性、完整性或可靠性作出任何保證,對於基於該內容所採取的任何行為,不承擔任何責任,除非另有書面明確說明。
 暫無留言。 來發表第一則觀點吧。