


| Scenario | |
|---|---|
| Timeframe | Weekly |
| Recommendation | BUY STOP |
| Entry Point | 1.2700 |
| Take Profit | 1.2817, 1.2888 |
| Stop Loss | 1.2610 |
| Key Levels | 1.2329, 1.2451, 1.2573, 1.2695, 1.2817, 1.2888 |
| Alternative scenario | |
|---|---|
| Recommendation | SELL STOP |
| Entry Point | 1.2570 |
| Take Profit | 1.2451, 1.2329 |
| Stop Loss | 1.2660 |
| Key Levels | 1.2329, 1.2451, 1.2573, 1.2695, 1.2817, 1.2888 |
Current trend
Against strong American and poor British macroeconomic statistics, the GBP/USD pair is trying to grow, trading around 1.2650.
The British Retail Consortium’s (BRC) August Retail Price Index data, published yesterday, confirmed a further slowdown in price growth to 6.9%, with food falling to 11.5% and non-food remaining at 4.7%. Despite the decline in inflationary pressures, they are still quite high, as a result of which the Bank of England is likely to maintain the “hawkish” rhetoric, supporting the pound.
Meanwhile, the US consumer confidence index in August decreased from 114.0 points to 106.1 points instead of rising to 116.0 points, and the number of open vacancies in the labor market in August decreased from 9.165M to 8.827M compared to the forecast of 9.465M. The national economy is showing signs of weakening, against which the US Federal Reserve may refuse to further increase the cost of borrowing so as not to create excessive pressure on consumption and the labor market.
Today, investors are waiting for the publication of August data on US non-farm payrolls from Automatic Data Processing (ADP): the figure may slow down from 324.0K to 195.0K, in which case the US currency may come under additional pressure.
Support and resistance
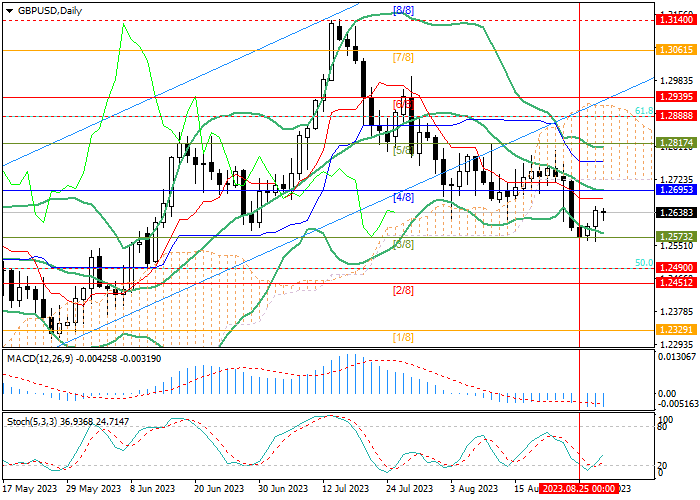
The trading instrument is trying to grow but to change the downward trend, it needs to break above 1.2695 (Murrey level [4/8], the middle line of Bollinger bands), and then the growth may continue to 1.2817 (Murrey level [5/8]) and 1.2888 (Fibonacci retracement 61.8%). The key “bearish” level is 1.2573 (Murrey’s level [3/8]), the breakdown of which will allow the quotes to reach 1.2451 (Murrey’s level [2/8]) and 1.2329 (Murrey’s level [1/8]).
Technical indicators do not give a single signal: Bollinger bands are directed downwards, Stochastic reversed upwards, and the MACD histogram is stable in the negative zone.
Resistance levels: 1.2695, 1.2817, 1.2888.
Support levels: 1.2573, 1.2451, 1.2329.
Trading tips
Long positions may be opened above 1.2695 with the targets at 1.2817, 1.2888 and stop loss around 1.2610. Implementation period: 5–7 days.
Short positions should be opened below 1.2573 with the targets at 1.2451, 1.2329, and stop loss around 1.2660.
風險提示:本文所述僅代表作者個人觀點,不代表 Followme 的官方立場。Followme 不對內容的準確性、完整性或可靠性作出任何保證,對於基於該內容所採取的任何行為,不承擔任何責任,除非另有書面明確說明。
 暫無留言。 來發表第一則觀點吧。