


| Scenario | |
|---|---|
| Timeframe | Weekly |
| Recommendation | SELL STOP |
| Entry Point | 40600.00 |
| Take Profit | 39100.00, 37500.00 |
| Stop Loss | 41600.00 |
| Key Levels | 37500.00, 39100.00, 40625.00, 42187.50, 43750.00, 45312.50 |
| Alternative scenario | |
|---|---|
| Recommendation | BUY STOP |
| Entry Point | 42750.00 |
| Take Profit | 43750.00, 45312.50 |
| Stop Loss | 41900.00 |
| Key Levels | 37500.00, 39100.00, 40625.00, 42187.50, 43750.00, 45312.50 |
Current trend
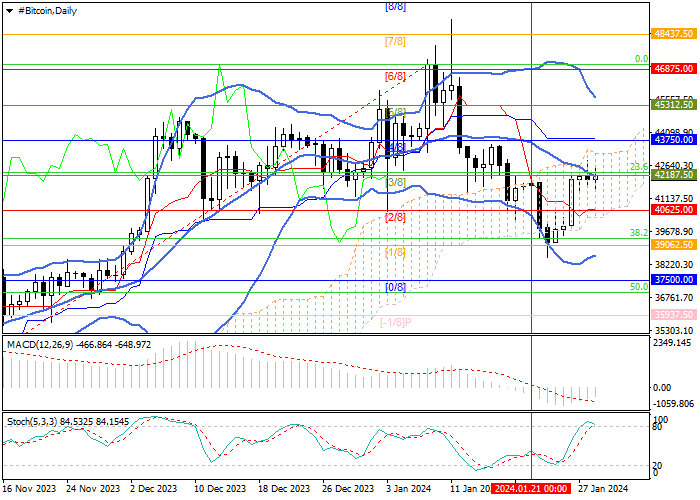
Last week, the BTC/USD pair had ambiguous dynamics: the price tried to break below the 39100.00 mark (Murrey level [1/8], 38.2% Fibonacci retracement), but could not do this and resumed growth, restoring all lost positions.
Experts explained the initial drop in quotes by market disappointment due to insufficient trading volumes of bitcoin ETFs and the possibility of postponing the start of monetary policy easing in the United States; however, they named very different reasons for the strengthening of upward dynamics to the 42000.00 mark, from the sudden liquidation of short positions by 60.0 million dollars to the announcement by the People's Bank of China of a reduction in the norms of reserving funds for local banks, which should lead to the release of a significant amount of liquidity, which can be directed, among other things, to the cryptocurrency market. This scenario seems quite likely, since digital assets are still very popular among Chinese investors, despite the de facto ban on trading cryptocurrencies imposed by the authorities in 2021. As Chainalysis notes, entrepreneurs have learned to circumvent restrictions, and last year the total volume of cryptocurrency transactions in China exceeded 150.0 billion dollars.
Nevertheless, it is premature to talk about a change in the downtrend: inflation in the American economy resumed growth in December, and the risks of its further acceleration due to the aggravation of global geopolitical tensions remain. Under these conditions, the US Federal Reserve is likely to hold current interest rates for a long time, which means that the dollar will receive support against alternative assets, including digital ones.
Support and resistance
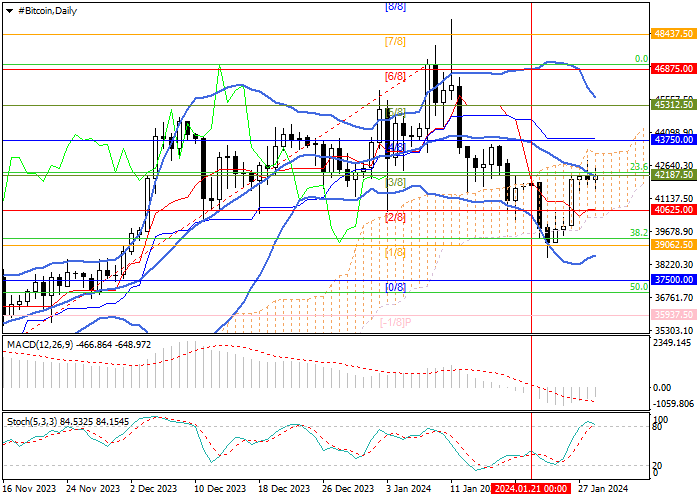
Technically, the price is testing the 42187.50 mark (Murrey level [3/8], 23.6% Fibonacci retracement) supported by the central line of Bollinger Bands, consolidating above which will allow it to continue moving to the levels of 43750.00 (Murrey level [4/8]) and 45312.50 (Murrey level [5/8]). The key for the "bears" is the level of 40625.00 (Murrey level [2/8]), the breakdown of which will be the catalyst for a decline to the area of 39100.00 (Murrey level [1/8], 38.2% Fibonacci retracement) and 37500.00 (Murrey level [0/8]).
Technical indicators signal the continuation of the downtrend: Bollinger Bands are pointing downwards, MACD is stable in the negative zone, and Stochastic is preparing to leave the overbought zone.
Resistance levels: 42187.50, 43750.00, 45312.50.
Support levels: 40625.00, 39100.00, 37500.00.
Trading tips
Short positions should be opened below the 40625.00 mark with targets at 39100.00, 37500.00 and stop-loss of 41600.00. Implementation period: 5–7 days.
Long positions should be opened from the level of 42750.00 with targets at 43750.00, 45312.50 and stop-loss of 41900.00.
風險提示:本文所述僅代表作者個人觀點,不代表 Followme 的官方立場。Followme 不對內容的準確性、完整性或可靠性作出任何保證,對於基於該內容所採取的任何行為,不承擔任何責任,除非另有書面明確說明。
 暫無留言。 來發表第一則觀點吧。