


| Scenario | |
|---|---|
| Timeframe | Weekly |
| Recommendation | BUY STOP |
| Entry Point | 17070.0 |
| Take Profit | 17410.0 |
| Stop Loss | 16900.0 |
| Key Levels | 16530.0, 16850.0, 17070.0, 17410.0 |
| Alternative scenario | |
|---|---|
| Recommendation | SELL STOP |
| Entry Point | 16850.0 |
| Take Profit | 16530.0 |
| Stop Loss | 17000.0 |
| Key Levels | 16530.0, 16850.0, 17070.0, 17410.0 |
Current trend
The leading index of the Frankfurt Stock Exchange DAX 40 is correcting at around 17012.0: the upward dynamics are intensifying against the backdrop of a local correction in the bond market and ahead of the publication of new corporate reports.
Tomorrow, the Austrian banking group Raiffeisen Bank International will publish its financial results: revenue is expected to be 2.07 billion euros, slightly lower than the 2.25 billion euros shown in the previous quarter, and earnings per share are expected to be 1.84 euros after 2.79 euros in the previous period. Forecasts for financial group Banco Santander's report call for revenue of 14.47 billion euros, down from 14.86 billion euros previously recorded, and earnings per share of around 0.163 euros, down from 0.17 euros in the previous quarter.
The growth of the index is still supported by the situation in the bond market, where there has been a local downward correction: 10-year bonds dropped to 2.228% from 2.364%, the highest value recorded in the middle of the month, and the rate on 20-year bonds is 2.491%, inferior to 2.586%. shown a week earlier.
The growth leaders in the index are Continental AG ( 3.47%), Zalando SE ( 3.45%), Rheinmetall AG ( 3.03%), Vonovia SE ( 2.03%).
Among the leaders of the decline are Bayer AG (-4.86%), Infineon Technologies AG (-2.40%), Commerzbank AG (-1.31%).
Support and resistance
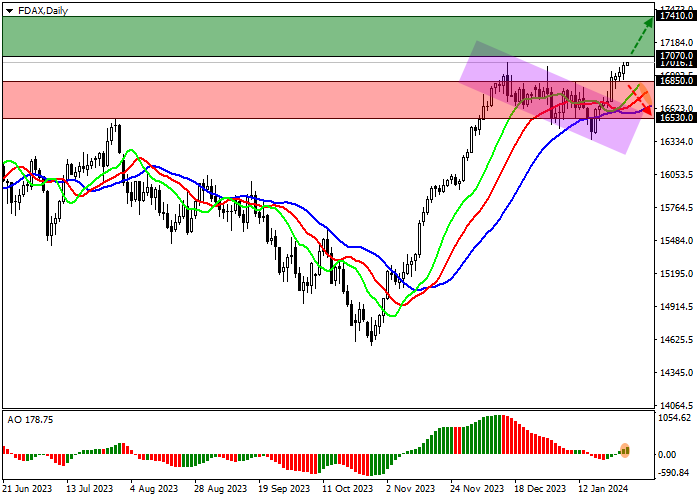
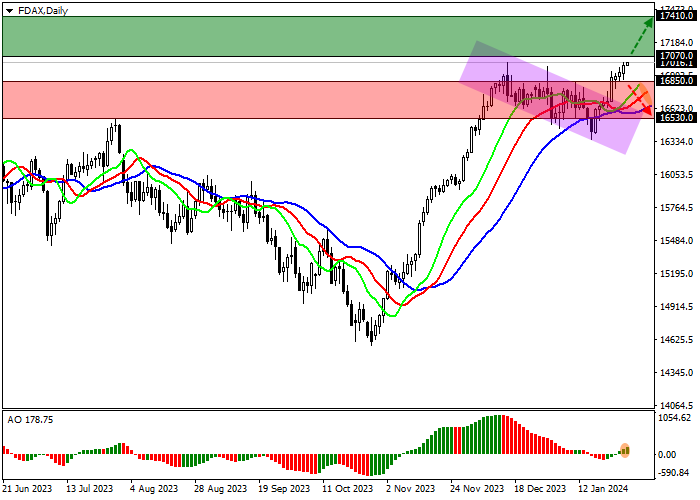
On the daily chart, the price is trading in a corrective trend, preparing to update the local high at 17000.0.
Technical indicators have already completely reversed towards growth and are ready to strengthen the current buy signal: fast EMAs on the Alligator indicator are moving away from the signal line, and the AO histogram, being in the buy zone, is forming ascending bars.
Support levels: 16850.0, 16530.0.
Resistance levels: 17070.0, 17410.0.
Trading tips
If the asset continues growing locally and the price consolidates above the local resistance level of 17070.0, long positions will be relevant with target at 17410.0. Stop-loss — 16900.0. Implementation time: 7 days and more.
If the asset continues declining and the price consolidates below 16850.0, short positions can be opened with the target at 16530.0. Stop-loss — 17000.0.
風險提示:本文所述僅代表作者個人觀點,不代表 Followme 的官方立場。Followme 不對內容的準確性、完整性或可靠性作出任何保證,對於基於該內容所採取的任何行為,不承擔任何責任,除非另有書面明確說明。
 暫無留言。 來發表第一則觀點吧。