


Gilead Sciences, Inc. is an US American biopharmaceutical company. It focuses on researching and developing antiviral drugs used in the treatment of HIV/AIDS, hepatitis B, hepatitis C, influenza, and COVID-19, including ledipasvir and sofosbuvir. In the 2000s, Gilead received approval for drugs including Viread and Hepsera, among others. It began evolving from a biotechnology company into a pharmaceutical company, acquiring several subsidiaries, though it still relied heavily on contracting to manufacture its drugs. Founded in 1987 and headquartered in Foster City, California, US, Gilead Sciences is a part of Nasdaq-100 and S&P-100 indices. One can trade it under the ticker $GILD at NASDAQ.
Gilead Sciences Monthly Elliott Wave Analysis 02.11.2024
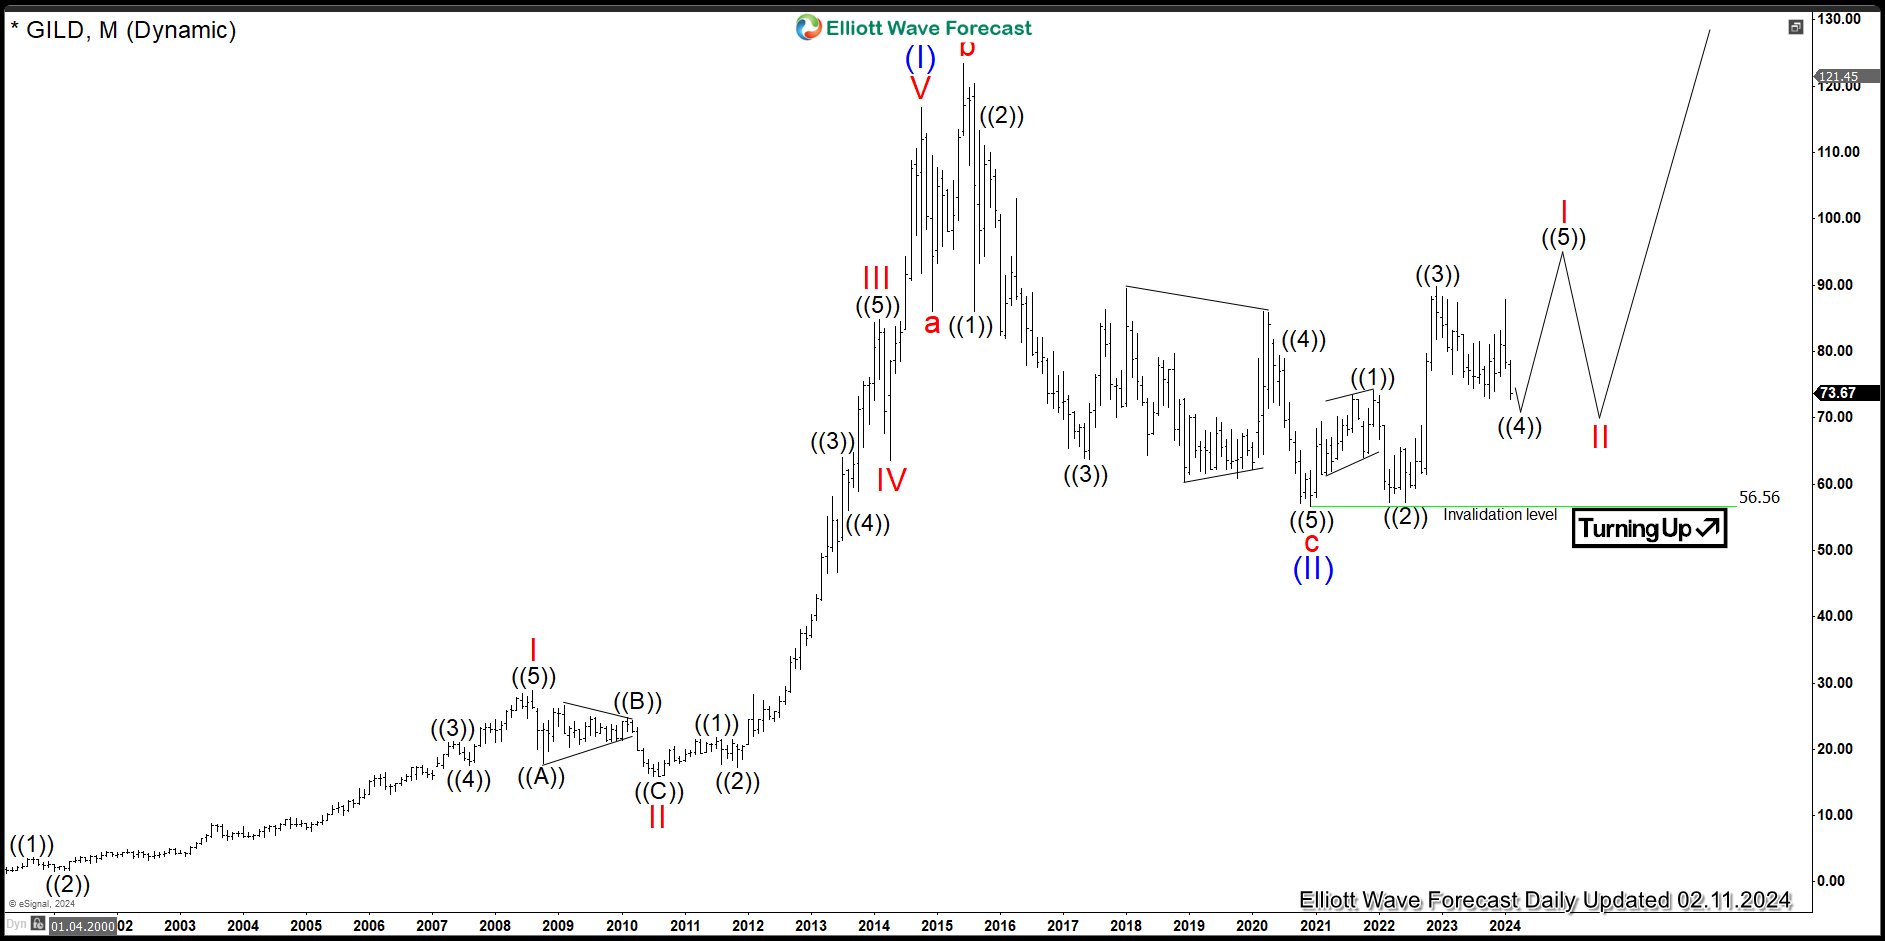
The monthly chart below shows the Gilead Sciences shares $GILD traded at NASDAQ. From the IPO in 1992, the stock price has developed an initial cycle higher in blue wave (I) of super cycle degree towards 116.83 highs in October 2014. The impulsive structure higher shows an extended wave III. As a matter of fact, red wave III has surpassed 2.0x of the wave I. From the October 2014 highs, a correction lower in blue wave (II) has unfolded as an Elliott wave irregular flat pattern being 3-3-5 structure.
Firstly, red wave a of blue wave (II) has printed a low at $85.95 in December 2014. Then, a bounce has set an all-time high in June 2015. Later, from $123.37 highs, the price has broken $85.95 lows opening up next extension lower. It is the preferred view that red wave c has found an important bottom in December 2020. While above $56.56 lows, a new bullish cycle in blue wave (III) might have started and is now in the initial stages. The target for blue wave (III) will be 173-245 area and even higher.
In shorter cycles, red wave I of blue wave (III) might be in progress. It is unfolding as a leading diagonal pattern being 5-3-5-3-5 structure. Within it, waves ((1))-((3)) have ended already. Currently, pullback in black wave ((4)) is taking place and should find support in 7 swings against June 2022 lows. Then, next leg higher in black wave ((5)) should complete the structure of red wave I. Following pullback in red wave II should see support in 3, 7 swings against December 2020 lows for an acceleration higher in red wave III of blue wave (III).
Gilead Sciences Daily Elliott Wave Analysis 02.11.2024
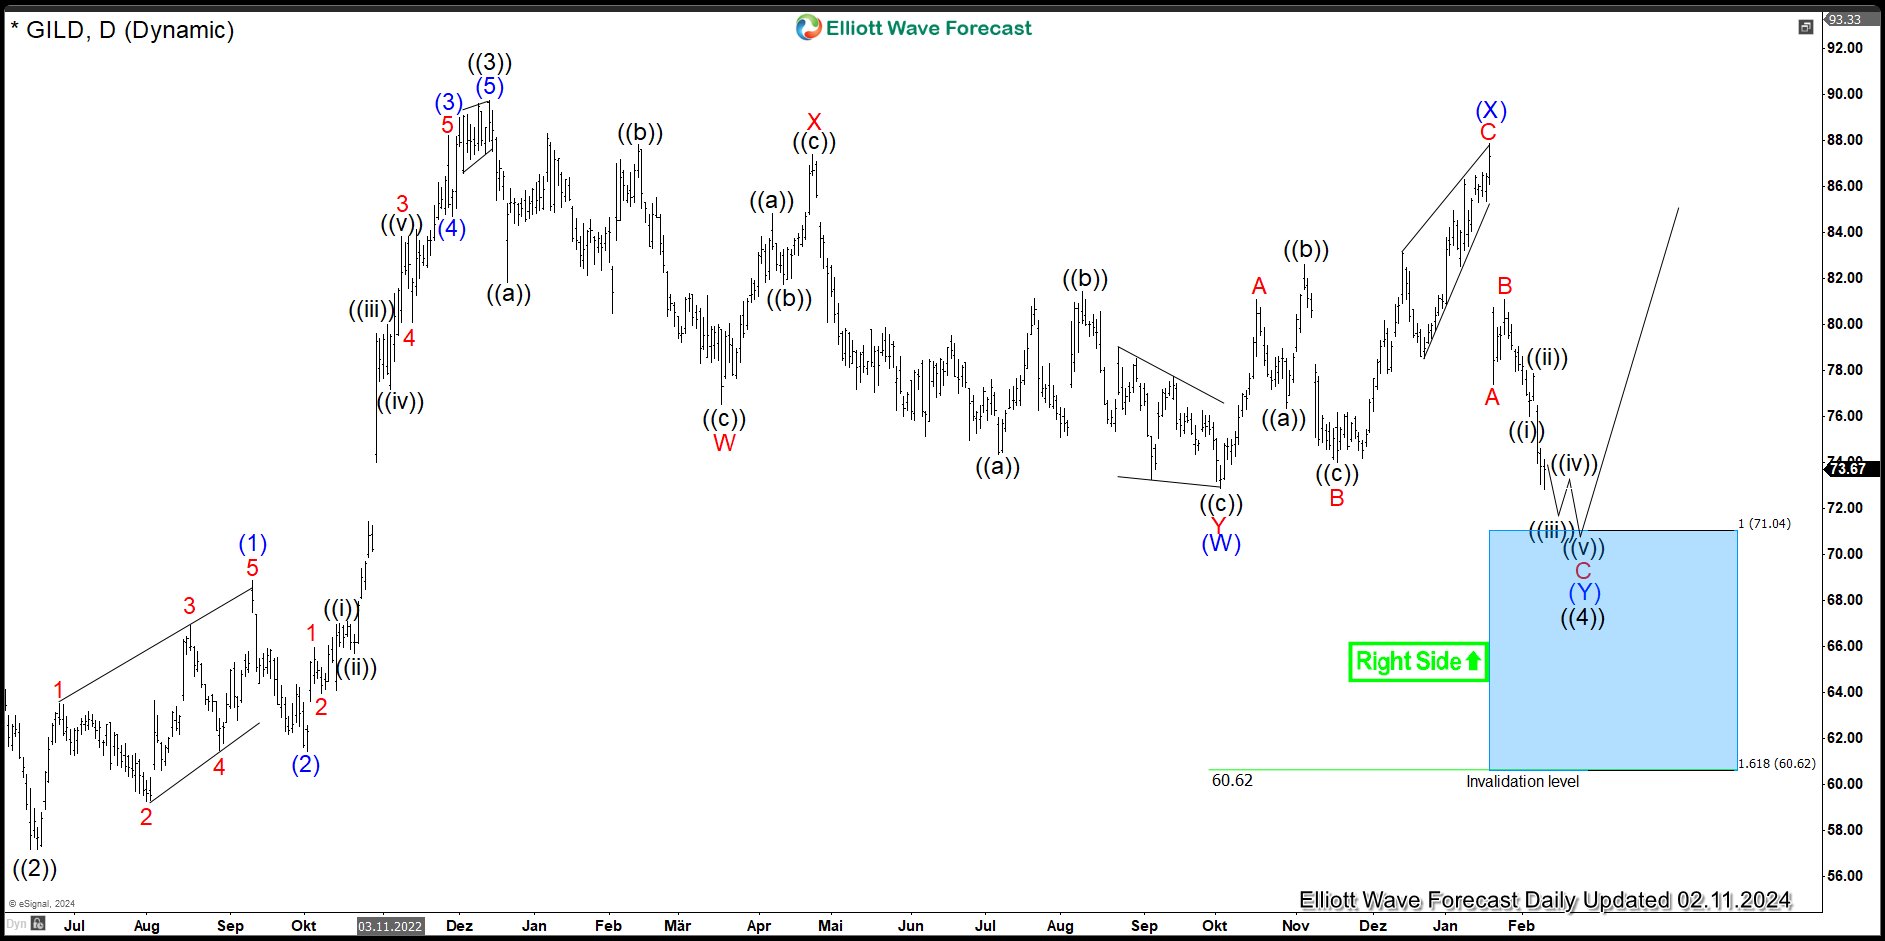
The daily chart below shows in more detail the advance in black wave ((3)) and a pullback in black wave ((4)). From the June 2022 lows, black wave ((3)) of red wave I has ended in December 2022. It has the pattern of an impulse which is the most typical characteristics of the 3rd waves. From the 89.74 highs, correction in wave ((4)) is taking place. Hereby, the consolidation unfolds as a double three pattern. Firstly, from the December 2022 highs, 3 swings of blue (W) have set a low at $72.87 in October 2023. Secondly, a bounce in blue wave (X) has printed a connector high at $87.86. Now, $GILD has broken $72.87 lows opening up a bearish sequence. Blue wave (Y) should reach in 3 swings towards 71.04-60.62 area. From the bluebox area, expect another leg higher in black wave ((5)). The target will be 94.13-101.27 area and possibly higher.
Investors and traders can be using 71.04-60.62 bluebox area as a buying opportunity in $GILD targeting 94.13-101.27 area and higher in short-term and 173-245 area and beyond in the long run.
風險提示:本文所述僅代表作者個人觀點,不代表 Followme 的官方立場。Followme 不對內容的準確性、完整性或可靠性作出任何保證,對於基於該內容所採取的任何行為,不承擔任何責任,除非另有書面明確說明。
 暫無留言。 來發表第一則觀點吧。