Hello everyone. In today’s article, we will look at the past performance of the 1 Hour Elliott Wave chart of Consumer Staples Select Sector ($XLP). The rally from 2.14.2024 low at $72.36 unfolded as 5 waves impulse. So, we expected the pullback to unfold in 3 swings and find buyers again. We will explain the structure & forecast below:
$XLP 1H Elliott Wave Chart 3.01.2024:
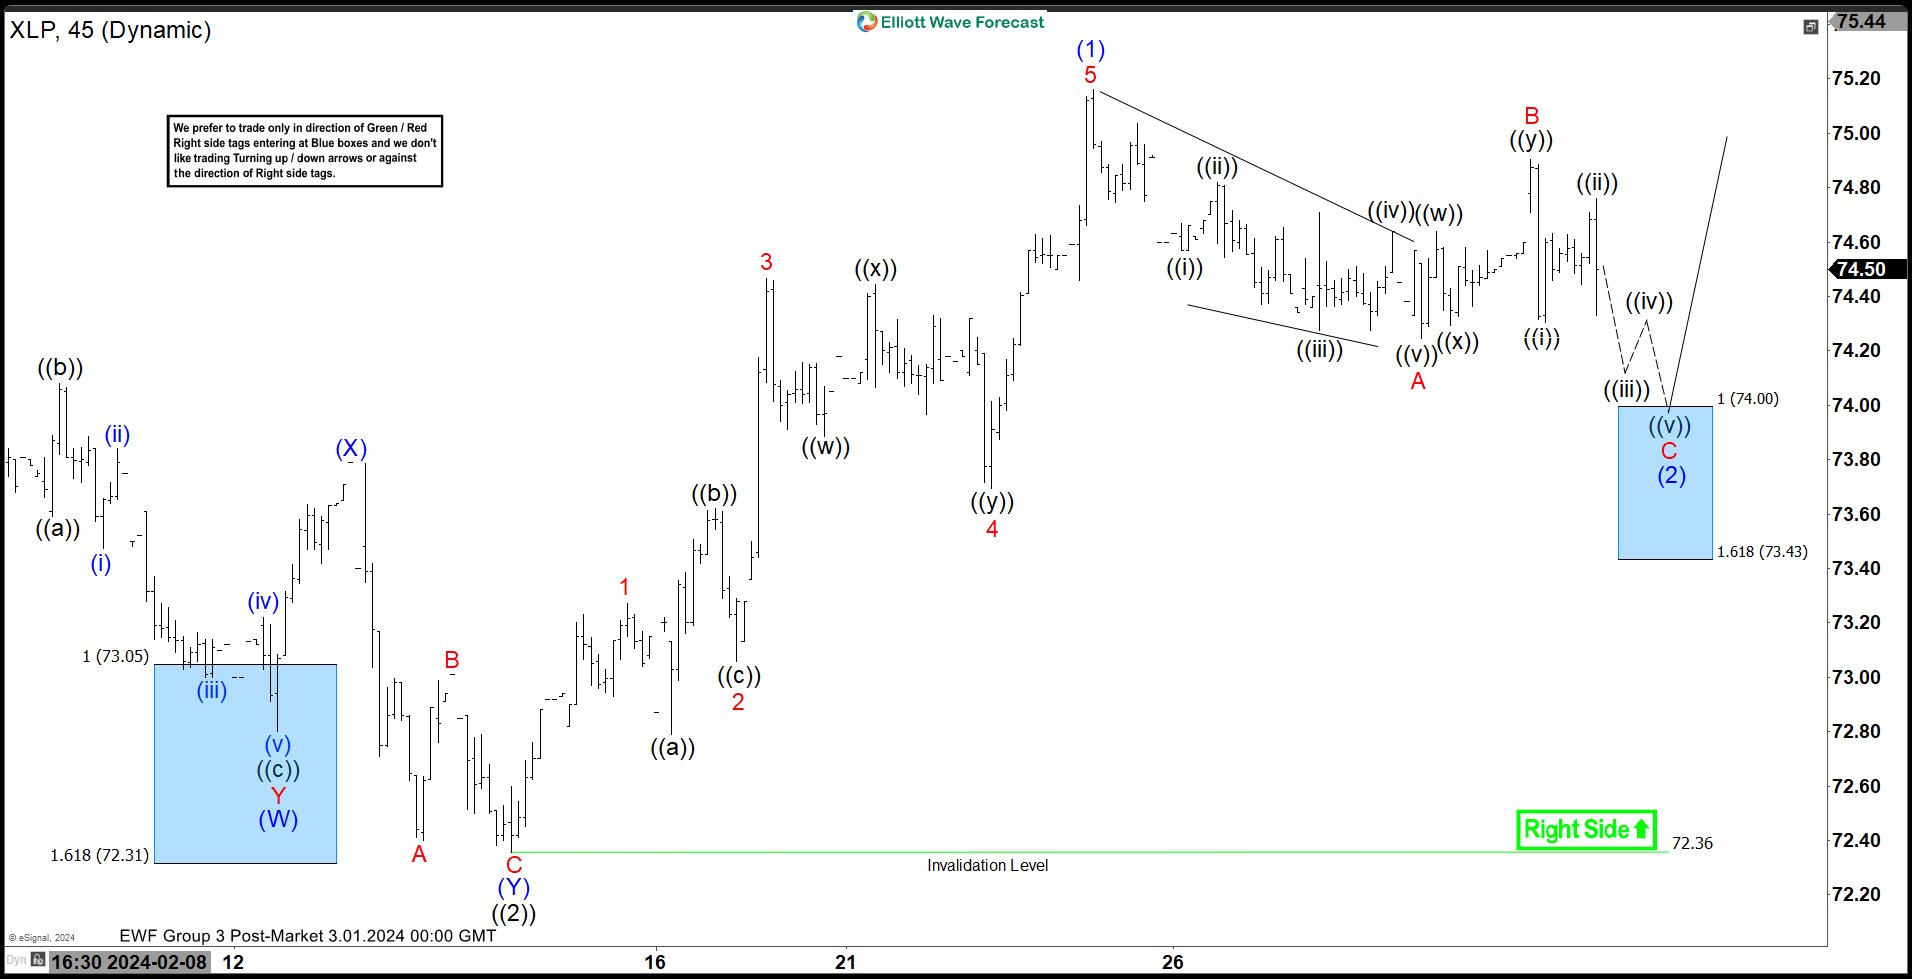 Here is the 1H Elliott Wave count from 3.01.2024. We expected the pullback to find buyers at the blue box area at 74.00 – 73.43 in 3 swings.
$XLP 1H Elliott Wave Chart 3.03.2024:
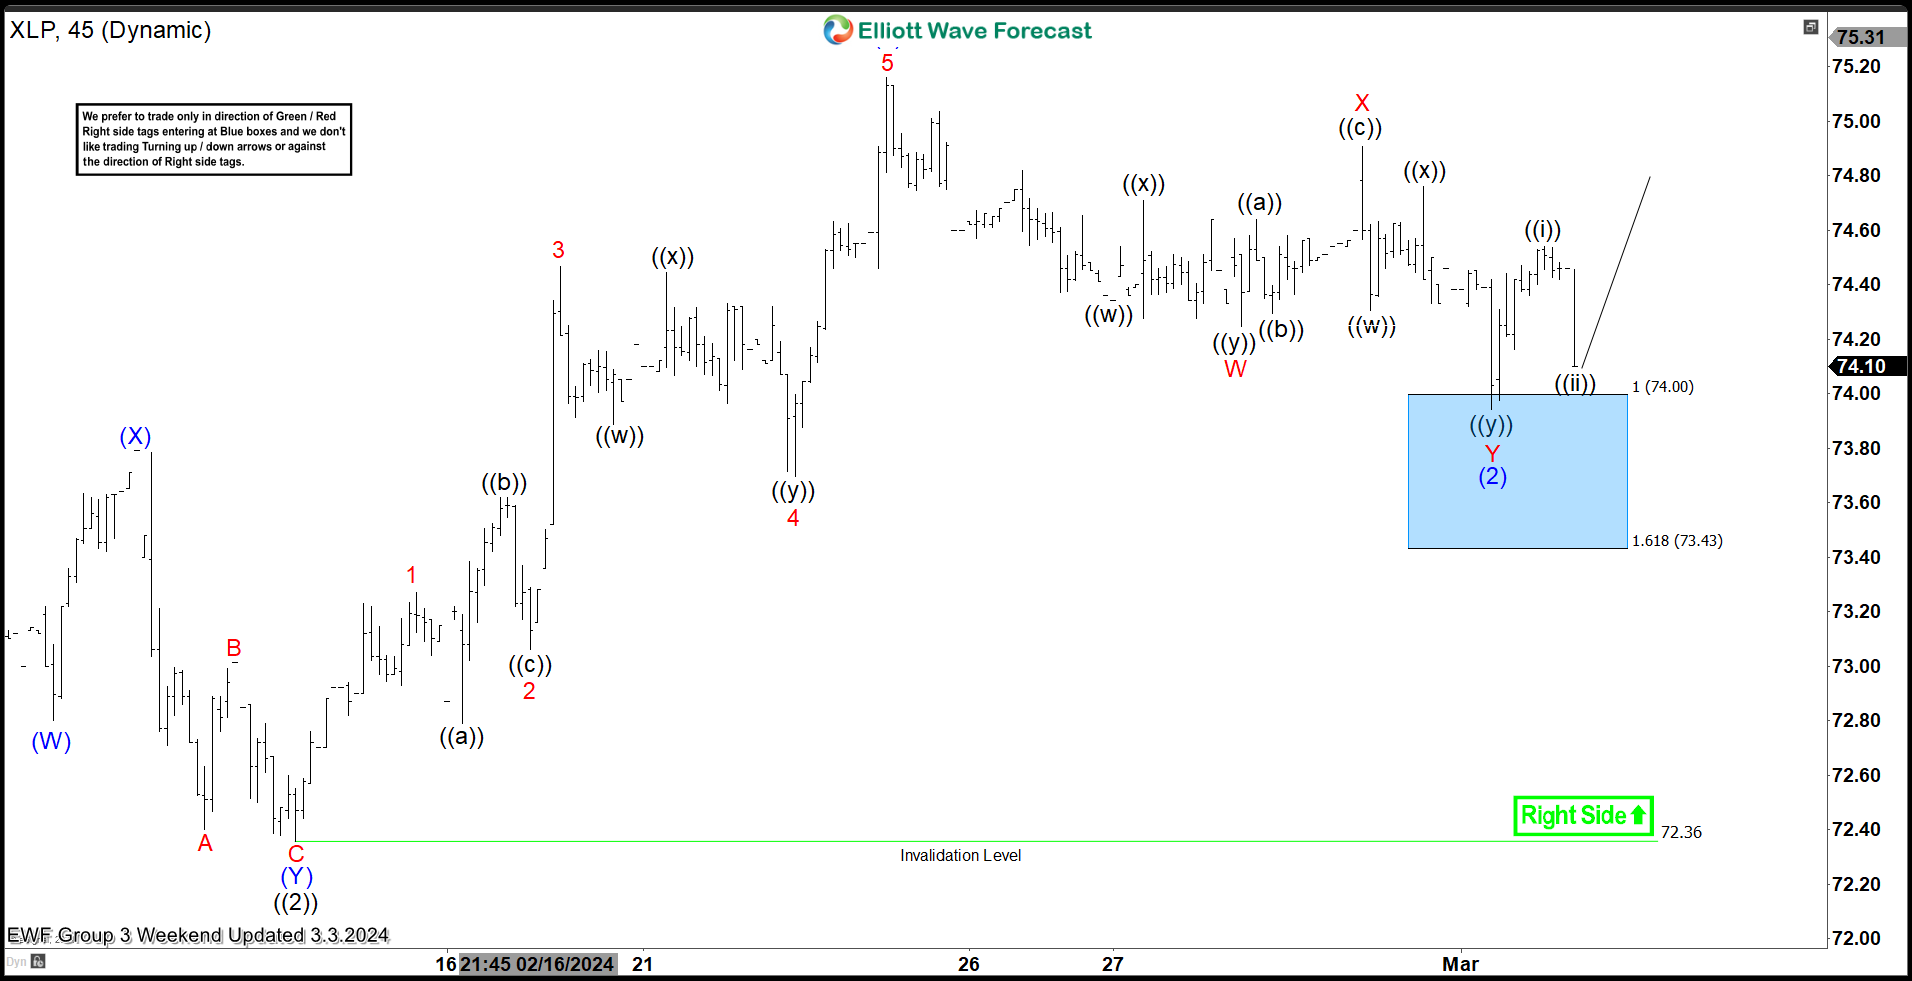 Here is the 1H update few days later from 3.03.2024 showing the bounce taking place as expected. The ETF reacted higher from the blue box area after 3 swings allowing longs to get a risk free position. The ETF is expected to remain supported towards $76 – 78 before another pullback can happen.
風險提示:本文所述僅代表作者個人觀點,不代表 Followme 的官方立場。Followme 不對內容的準確性、完整性或可靠性作出任何保證,對於基於該內容所採取的任何行為,不承擔任何責任,除非另有書面明確說明。

暫無評論,立馬搶沙發