| Scenario | |
|---|---|
| Timeframe | Weekly |
| Recommendation | BUY STOP |
| Entry Point | 346.70 |
| Take Profit | 368.10 |
| Stop Loss | 340.00 |
| Key Levels | 310.60, 315.00, 327.90, 335.00, 340.00, 347.00, 368.00, 368.10 |
| Alternative scenario | |
|---|---|
| Recommendation | SELL STOP |
| Entry Point | 327.90 |
| Take Profit | 310.60 |
| Stop Loss | 332.00 |
| Key Levels | 310.60, 315.00, 327.90, 335.00, 340.00, 347.00, 368.00, 368.10 |
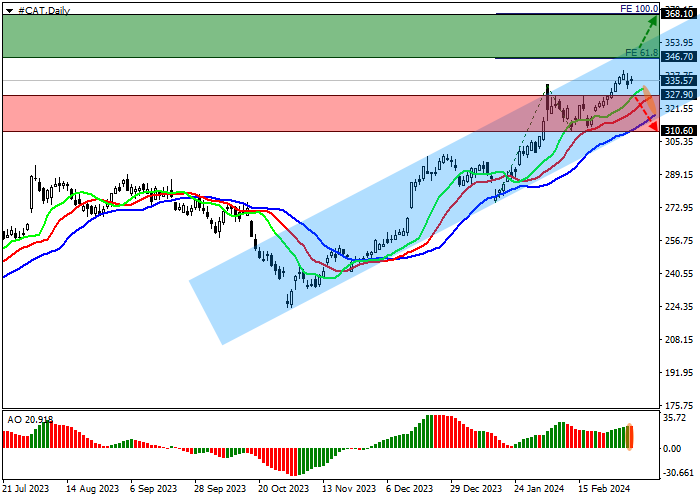
Shares of Caterpillar Inc., a manufacturer of construction and mining equipment, are trading in a global corrective trend at 335.00.
On the daily chart, the price stays within the ascending channel 347.00–315.00.
On the four-hour chart, the potential for further growth remains high, and consolidation above the initial trend level of 61.8% of the Fibonacci extension 346.00 will allow the quotes to grow to the basic trend level of 100.0% of the Fibonacci extension at 368.00.
Technical indicators maintain a buy signal against a correction: fast EMAs on the Alligator indicator are above the signal line, and the AO histogram forms corrective bars above the transition level.

Trading tips
Long positions may be opened after the price rises and consolidates above 346.70 with the target at 368.10. Stop loss is above the current price of 340.00. Implementation period: 7 days or more.
Short positions may be opened after the price declines and consolidates below 327.90 with the target at 310.60. Stop loss – 332.00.
風險提示:本文所述僅代表作者個人觀點,不代表 Followme 的官方立場。Followme 不對內容的準確性、完整性或可靠性作出任何保證,對於基於該內容所採取的任何行為,不承擔任何責任,除非另有書面明確說明。

暫無評論,立馬搶沙發