
| Scenario | |
|---|---|
| Timeframe | Weekly |
| Recommendation | BUY STOP |
| Entry Point | 104.60 |
| Take Profit | 108.30 |
| Stop Loss | 103.00 |
| Key Levels | 86.00, 98.60, 102.00, 103.00, 104.60, 108.00, 108.70 |
| Alternative scenario | |
|---|---|
| Recommendation | SELL STOP |
| Entry Point | 102.00 |
| Take Profit | 98.60 |
| Stop Loss | 103.00 |
| Key Levels | 86.00, 98.60, 102.00, 103.00, 104.60, 108.00, 108.70 |
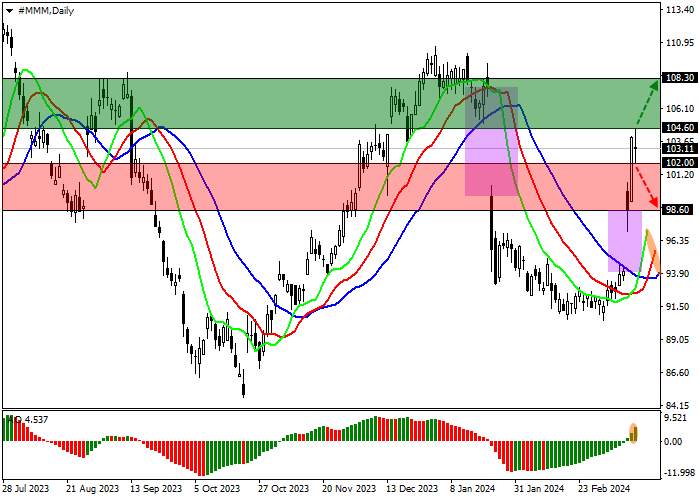
Shares of 3M Co., an American diversified innovation and manufacturing company, are trading at 103.00.
On the daily chart, the price is correcting within the global sideways channel 108.00–86.00.
On the four-hour chart, growth may continue, and the key resistance level is yesterday’s high of 104.60, after consolidating above which the quotes may reach the early January extreme of 108.70. Otherwise, a return to completion of the local price gap of 98.60–94.00 is expected.
Technical indicators are holding a buy signal: fast EMA on the Alligator indicator are significantly above the signal line, and the AO histogram is forming corrective bars in the buy zone.
Trading tips
Long positions may be opened after the price rises and consolidates above 104.60, with the target at 108.30. Stop loss – 103.00. Implementation period: 7 days or more.
Short positions may be opened after the price declines and consolidates below 102.00, with the target at 98.60. Stop loss – 103.00.
風險提示:本文所述僅代表作者個人觀點,不代表 Followme 的官方立場。Followme 不對內容的準確性、完整性或可靠性作出任何保證,對於基於該內容所採取的任何行為,不承擔任何責任,除非另有書面明確說明。

暫無評論,立馬搶沙發