
| Scenario | |
|---|---|
| Timeframe | Weekly |
| Recommendation | BUY STOP |
| Entry Point | 51.60 |
| Take Profit | 53.12, 56.25 |
| Stop Loss | 50.20 |
| Key Levels | 45.31, 46.88, 50.00, 51.56, 53.12, 56.25 |
| Alternative scenario | |
|---|---|
| Recommendation | BUY LIMIT |
| Entry Point | 50.00 |
| Take Profit | 53.12, 56.25 |
| Stop Loss | 48.70 |
| Key Levels | 45.31, 46.88, 50.00, 51.56, 53.12, 56.25 |
Current trend
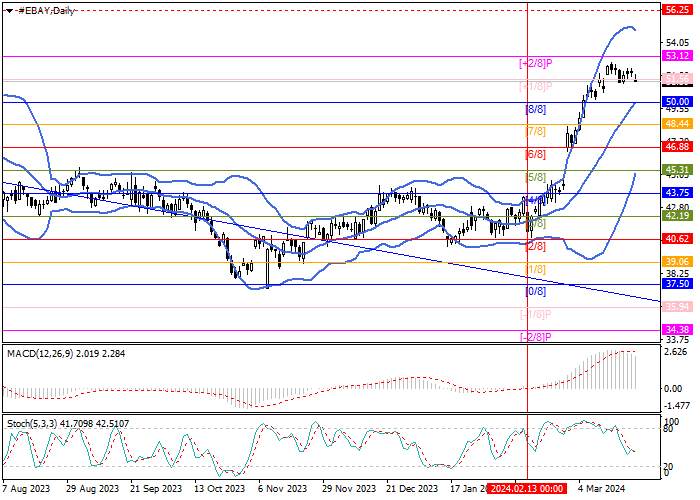
Shares of eBay Inc., an American online retailing company, have been growing for the second month in a row and have now entered the upper reversal range, where they are trading at 51.56 (Murrey level [ 1/8]), consolidating above which will allow quotes to continue upward dynamics to the levels of 53.12 (Murrey level [ 2/8]) and 56.25 (Murrey level [5/8], MN1).
The key for the "bears" is the upper border of the main Murrey trading range in the area of 50.00 (Murrey level [8/8]), supported by the central line of Bollinger Bands, consolidation below which may lead to the resumption of a significant decline in the trading instrument to the levels of 46.88 (Murrey level [6/8]) and 45.31 (Murrey level [5/8]).
Technical indicators confirm the continuation of the uptrend: Bollinger Bands are reversing up, MACD is increasing in a positive zone, while a downward reversal of Stochastic does not exclude a corrective pullback of the price to the area of 50.00, but it is unlikely to lead to a change in the current trend.
Support and resistance
Resistance levels: 51.56, 53.12, 56.25.
Support levels: 50.00, 46.88, 45.31.
Trading tips
Long positions can be opened above the 51.56 mark or after the price reversal around 50.00 with targets of 53.12, 56.25 and stop-losses of 50.20 and 48.70, respectively. Implementation period: 5–7 days.
風險提示:本文所述僅代表作者個人觀點,不代表 Followme 的官方立場。Followme 不對內容的準確性、完整性或可靠性作出任何保證,對於基於該內容所採取的任何行為,不承擔任何責任,除非另有書面明確說明。

暫無評論,立馬搶沙發