


| Scenario | |
|---|---|
| Timeframe | Weekly |
| Recommendation | SELL STOP |
| Entry Point | 1.2570 |
| Take Profit | 1.2490, 1.2451 |
| Stop Loss | 1.2630 |
| Key Levels | 1.2451, 1.2490, 1.2573, 1.2725, 1.2817, 1.2890 |
| Alternative scenario | |
|---|---|
| Recommendation | BUY STOP |
| Entry Point | 1.2730 |
| Take Profit | 1.2817, 1.2890 |
| Stop Loss | 1.2660 |
| Key Levels | 1.2451, 1.2490, 1.2573, 1.2725, 1.2817, 1.2890 |
Current trend
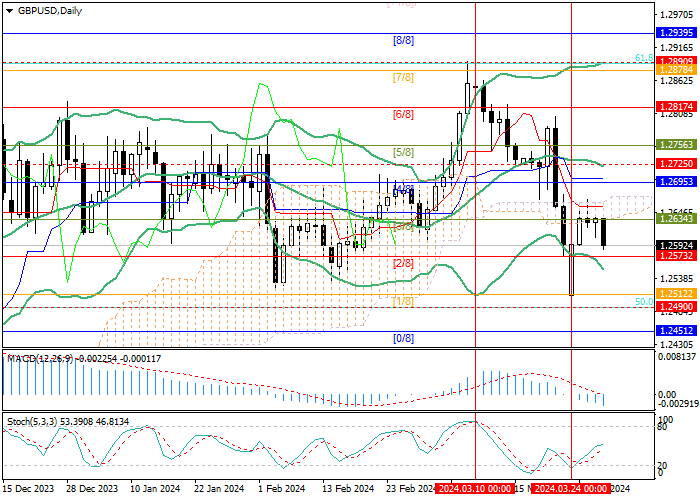
The GBP/USD pair has been declining for the third week. During the last few sessions, it has been trading around 1.2634 (Murrey level [3/8]) but today, the pound came under pressure again after the publication of data on the country’s gross domestic product (GDP).
Thus, in the fourth quarter, the British economy shrank by 0.3% and by 0.2% YoY, confirming a recession. These data, combined with a cooling labor market and a continued decline in inflation, increase the likelihood that the Bank of England will soon begin easing monetary policy. In January, unemployment reached 3.9%, the average level of wages with bonuses adjusted from 5.8% to 5.6%, and the February consumer price index – from 4.0% to 3.4%.
Today, data on US Q4 2023 GDP will be published: according to preliminary estimates, the growth of the American economy will be 3.2%, slightly less than 4.9% previously. The national economic recovery may be much faster than the British one, creating additional pressure on the GBP/USD pair.
Support and resistance
The trading instrument is close to 1.2573 (Murrey level [2/8]), a breakdown of which will allow it to fall to the area of 1.2490 (Fibonacci correction 50.0%), 1.2451 (Murrey level [0/8]). In case of consolidation above the key “bullish” support zone of 1.2695–1.2725 (Murrey level [4/8], middle line of Bollinger bands), the quotes will return to the area of 1.2817 (Murrey level [6/8]) and 1.2890 (Fibonacci correction 61.8 %).
Technical indicators record the formation of a downward trend: Bollinger bands reverse downwards, the MACD histogram is increasing in the negative zone but Stochastic is directed upwards, not excluding growth.
Resistance levels: 1.2725, 1.2817, 1.2890.
Support levels: 1.2573, 1.2490, 1.2451.
Trading tips
Short positions can be placed below 1.2573, with the targets at 1.2490, 1.2451, and stop loss 1.2630. Implementation time: 5–7 days.
Long positions may be opened above 1.2725, with the targets at 1.2817, 1.2890 and stop loss 1.2660.
風險提示:本文所述僅代表作者個人觀點,不代表 Followme 的官方立場。Followme 不對內容的準確性、完整性或可靠性作出任何保證,對於基於該內容所採取的任何行為,不承擔任何責任,除非另有書面明確說明。
 暫無留言。 來發表第一則觀點吧。