


Hello fellow traders. As our members know , NASDAQ has recently given us plenty of positive buying setups. In this article we’re going to present Elliott Wave charts of NQ_F published in the members area of the website. NASDAQ made a clear 3 waves pull back that has unfolded as Elliott Wave Double Three pattern. It made clear 3 waves down from the February 23rd peak and completed correction right at the Equal Legs zone ( Blue Box Area) . In further text we’re going to explain the Elliott Wave pattern and trading setup.
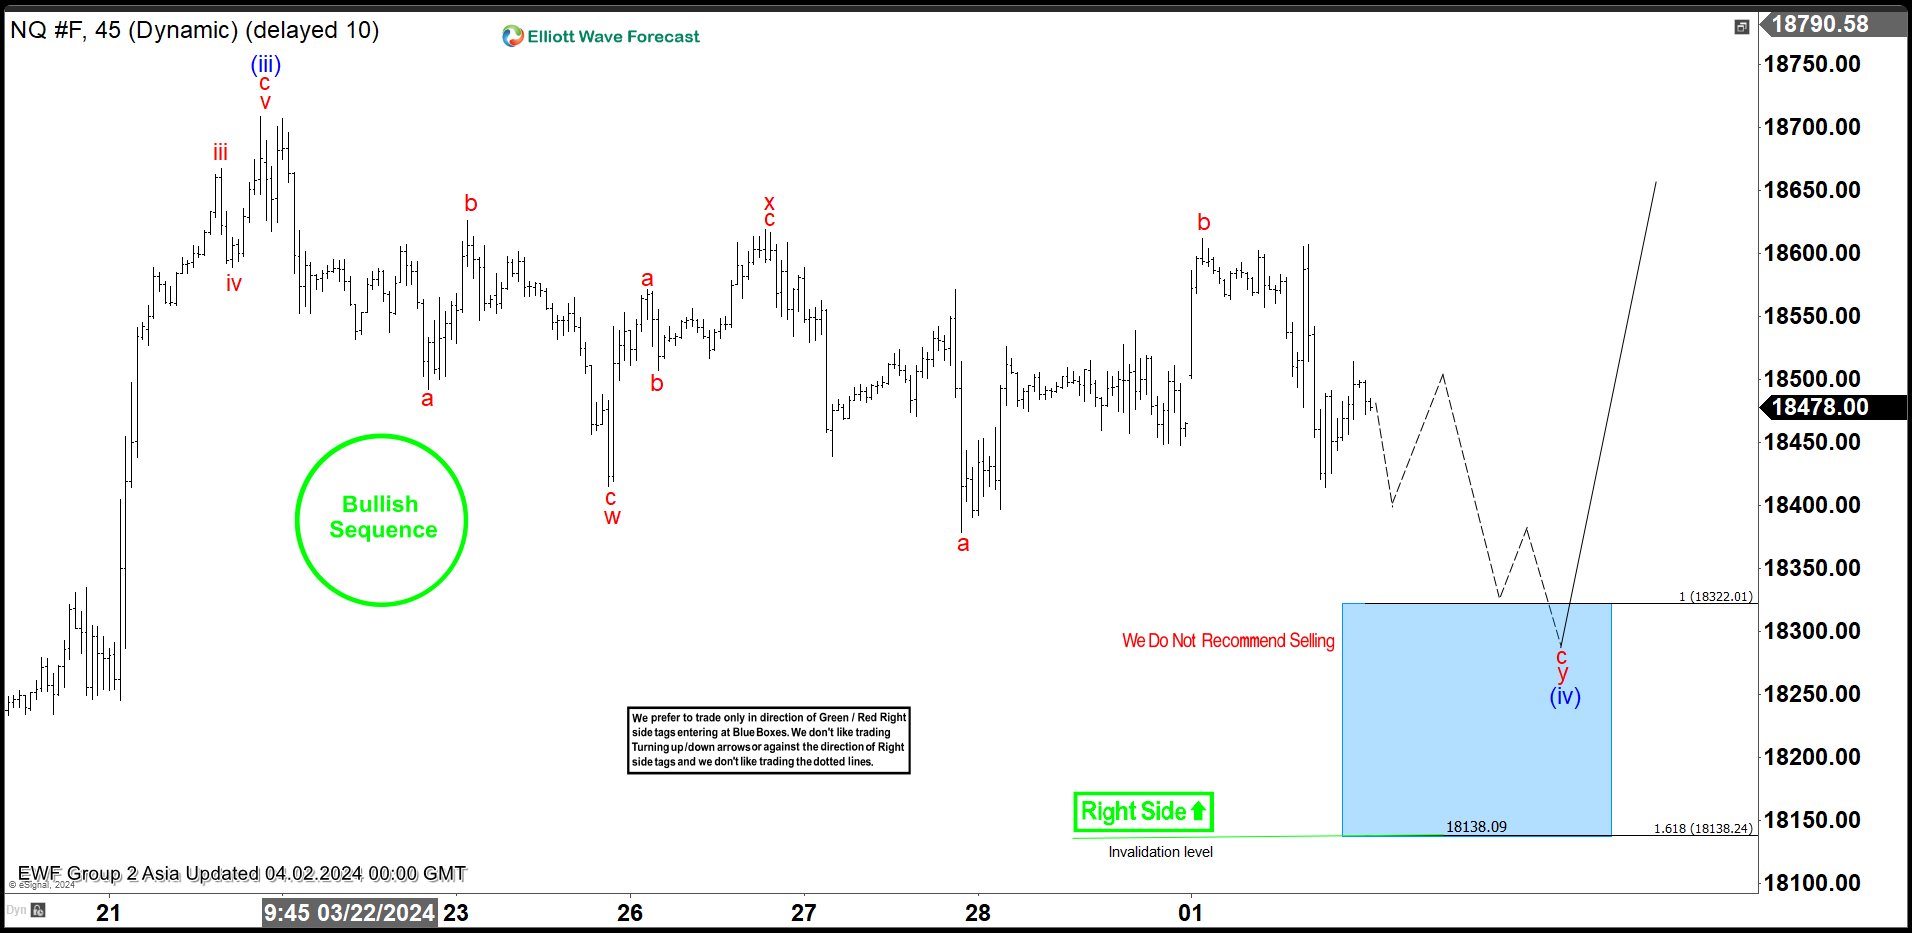
NASDAQ Elliott Wave 1 Hour Asia Chart 04.02.2024
The current view indicates that the intraday pullback is still in progress. We assume that the correction is unfolding as an Elliott Wave Double Three pattern with wxy red labeling. The price structure remains incomplete at the moment, suggesting further downside towards the 18322-18138.2 Blue Box Buying Zone. We don't recommend selling NASDAQ; instead, we prefer positioning ourselves on the long side from the Blue Box area. Once NQ_F reaches our designated buying zone, we expect an influx of buyers, potentially resulting in a rally towards new highs or a 3-wave bounce.
Official trading strategy on How to trade 3, 7, or 11 swing and equal leg is explained in details in Educational Video, available for members viewing inside the membership area.
Quick reminder on how to trade our charts :
Red bearish stamp+ blue box = Selling Setup
Green bullish stamp+ blue box = Buying Setup
Charts with Black stamps are not tradable. 🚫
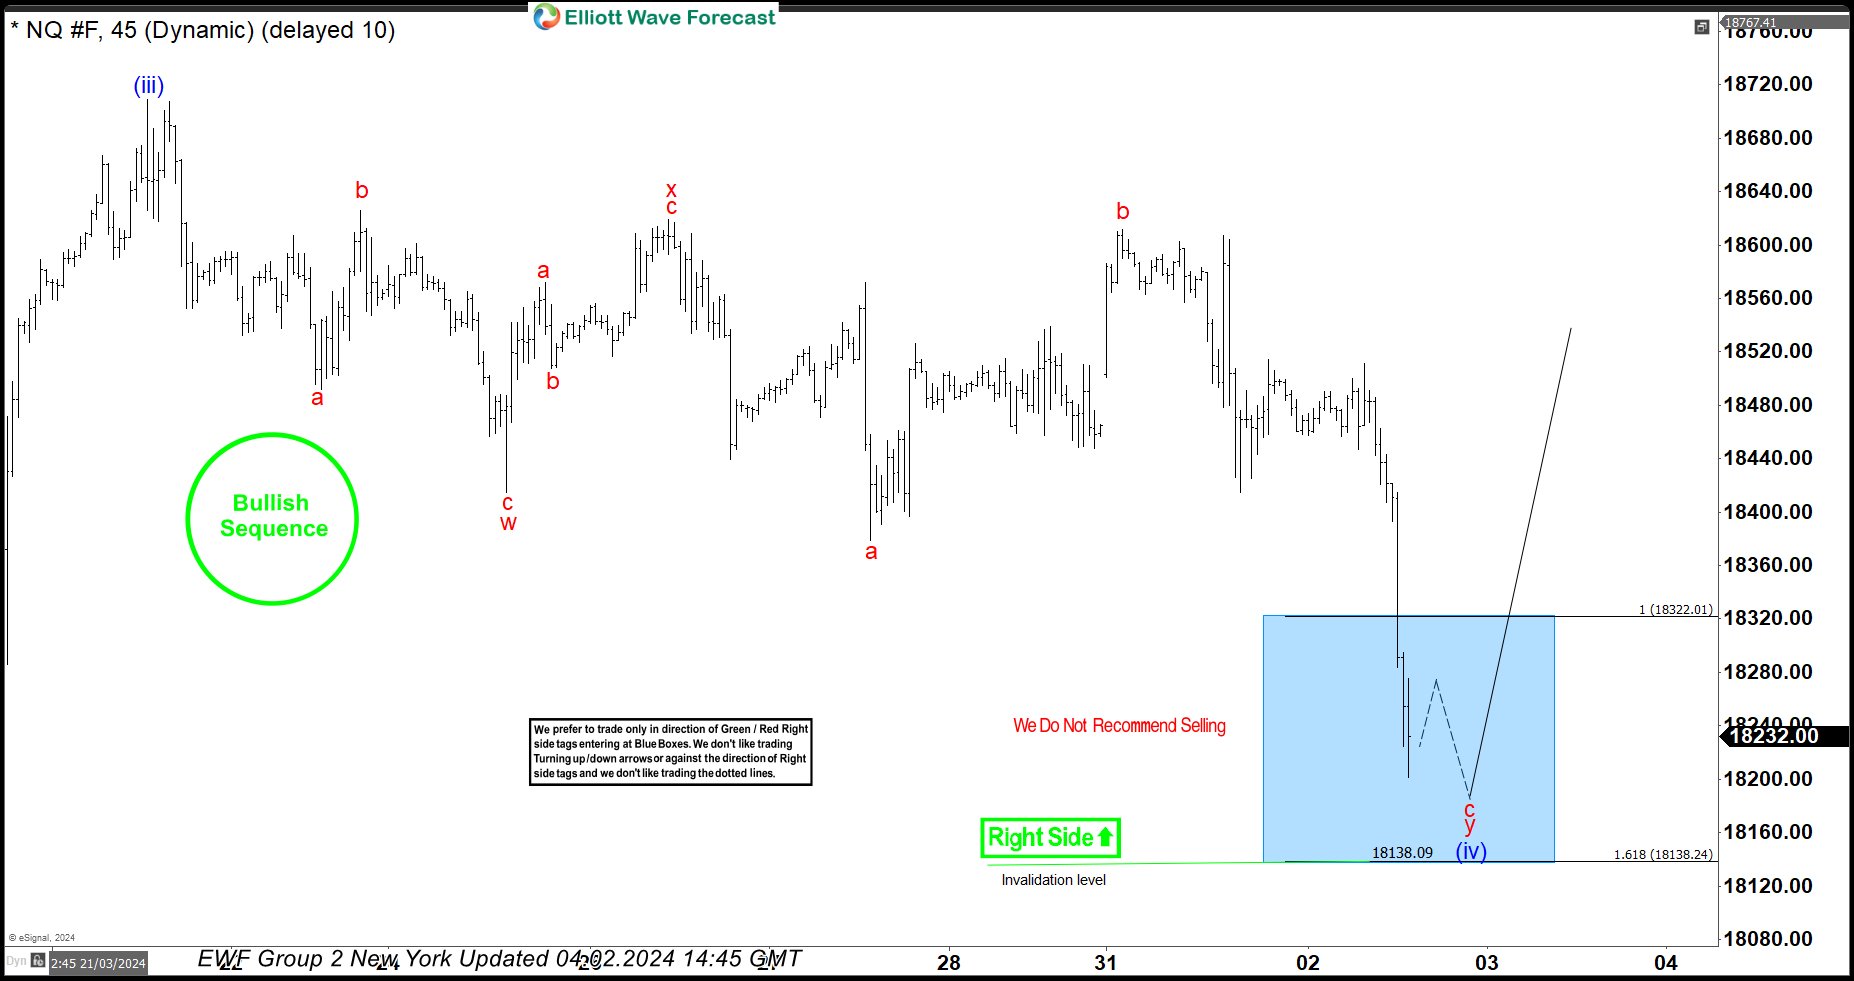
NASDAQ Elliott Wave 1 Hour Chart 04.02.2024
The futures have experienced a drop and have reached our buying zone, the Blue Box: 18322-18138.2. We are entering long positions within the Blue Box against the marked invalidation level. As the main trend is bullish, we expect to see at least a 3-wave bounce from the Blue Box. As soon as the price hits the 50 fibs against the x red connector, we will make positions risk-free and set stop loss at breakeven. A break below the 1.618 Fibonacci extension level, 18138.2, would invalidate the trade.
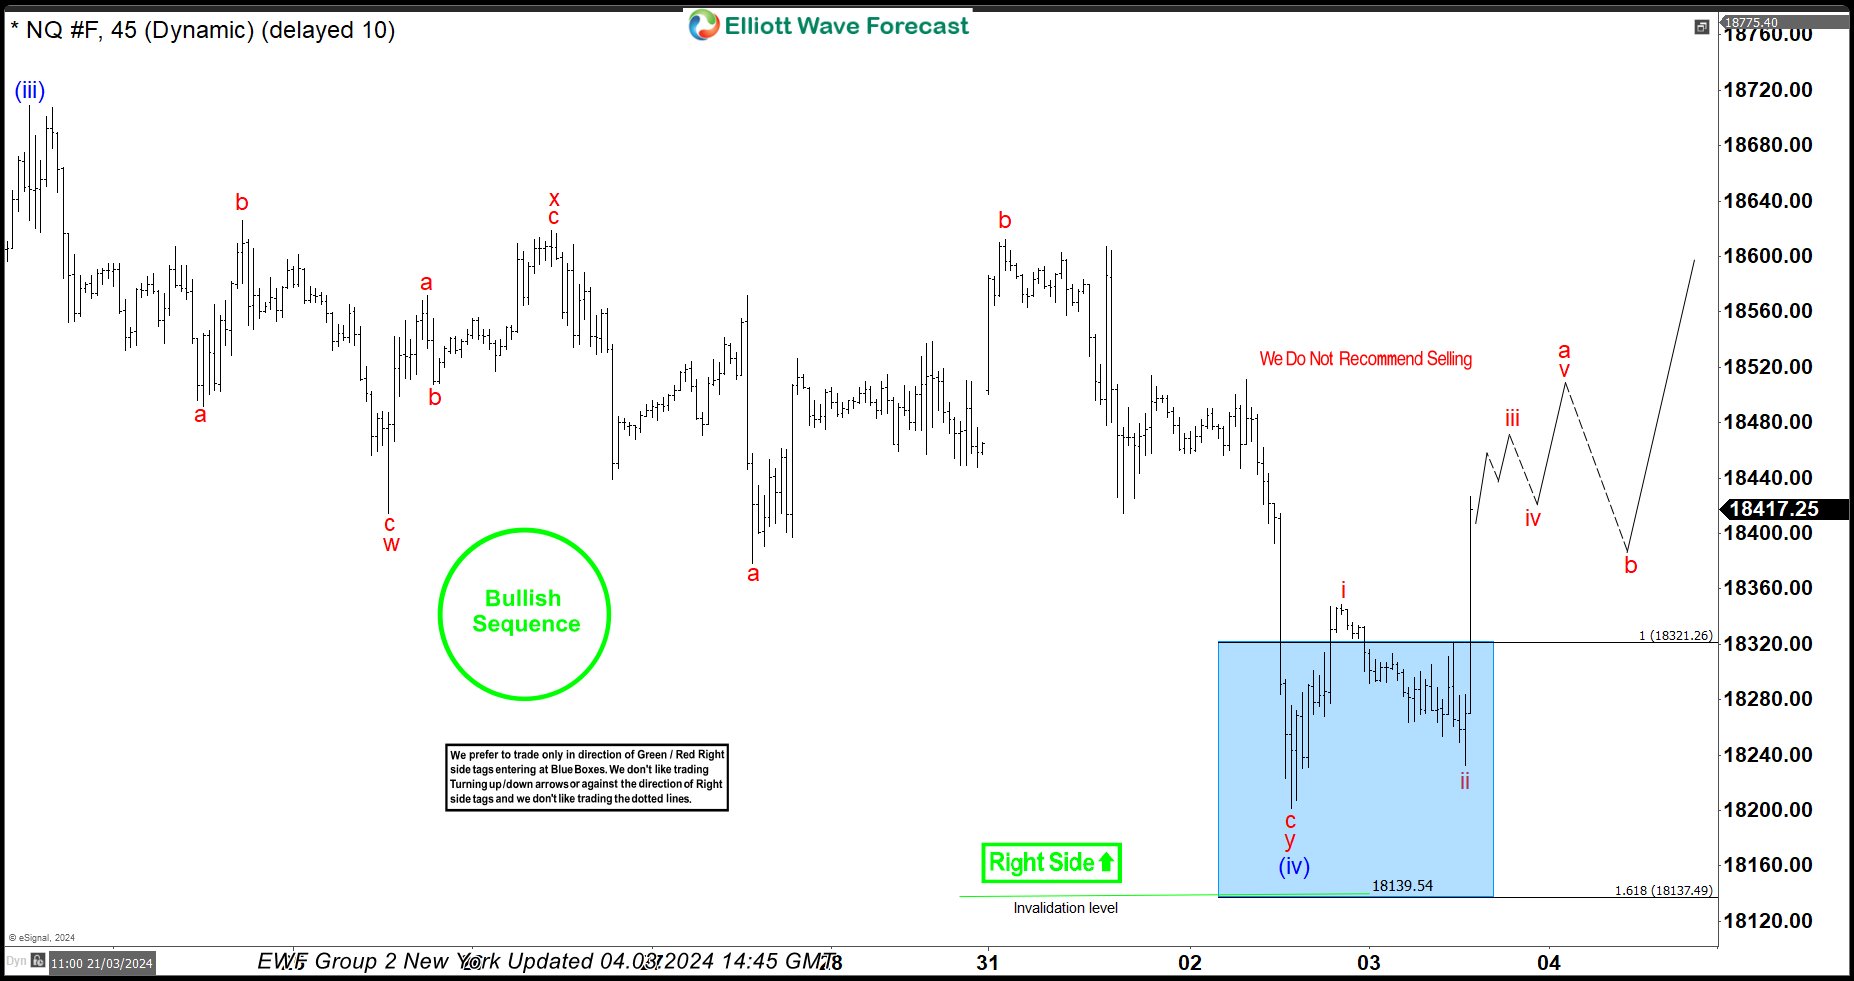
 NASDAQ Elliott Wave 1 Hour Chart 04.02.2024
The NASDAQ futures has found buyers as expected and is showing a very good reaction from the Blue Box Area. We count the pullback (ii) blue completed at the 17828 low. Consequently, any long positions should now be risk-free. We are anticipating a break of the (iii) blue peak to confirm that the next leg up is in progress.
Keep in mind that market is dynamic and presented view could have changed in the mean time. You can check most recent charts with target levels in the membership area of the site. Best instruments to trade are those having incomplete bullish or bearish swings sequences. We put them in Sequence Report and best among them are shown in the Live Trading Room
New to Elliott Wave ? Check out our Free Elliott Wave Educational Web Page and download our Free Elliott Wave Book.
風險提示:本文所述僅代表作者個人觀點,不代表 Followme 的官方立場。Followme 不對內容的準確性、完整性或可靠性作出任何保證,對於基於該內容所採取的任何行為,不承擔任何責任,除非另有書面明確說明。
 暫無留言。 來發表第一則觀點吧。