


| Scenario | |
|---|---|
| Timeframe | Weekly |
| Recommendation | SELL STOP |
| Entry Point | 1.0740 |
| Take Profit | 1.0681, 1.0645 |
| Stop Loss | 1.0775 |
| Key Levels | 1.0645, 1.0681, 1.0742, 1.0820, 1.0894, 1.0955 |
| Alternative scenario | |
|---|---|
| Recommendation | BUY STOP |
| Entry Point | 1.0820 |
| Take Profit | 1.0894, 1.0955 |
| Stop Loss | 1.0790 |
| Key Levels | 1.0645, 1.0681, 1.0742, 1.0820, 1.0894, 1.0955 |
Current trend
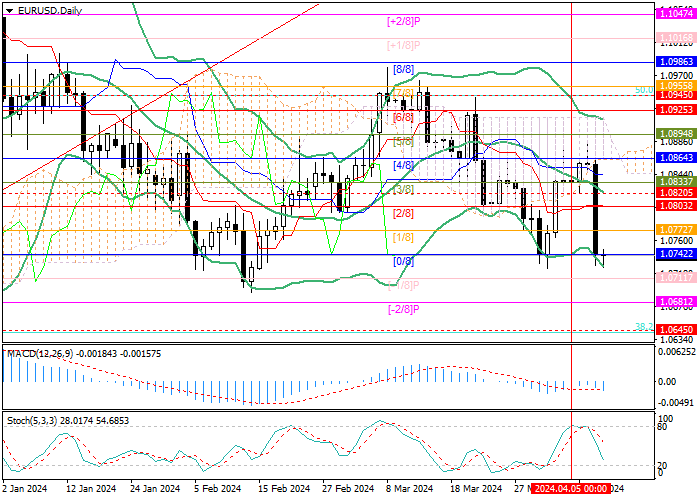
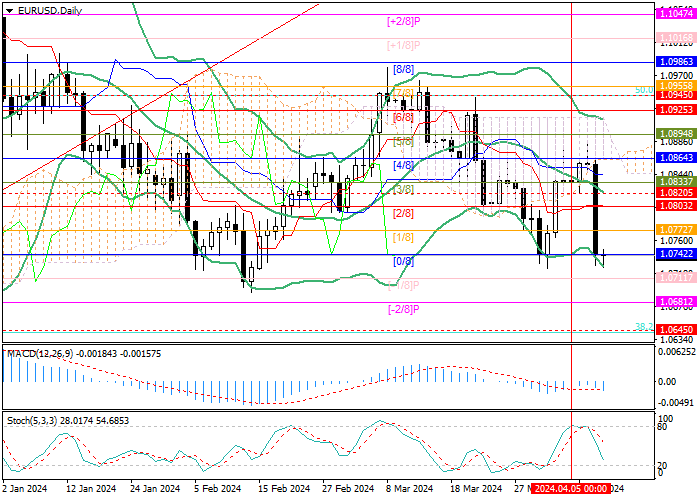
This week, the EUR/USD pair tried to grow, rising to 1.0885. However, after the publication of American macroeconomic statistics, it corrected downwards and is testing the level of 1.0742 (Murrey level [0/8]).
Thus, the US consumer price index amounted to 3.5% instead of the expected 3.4% YoY, and the core indicator reached 3.8% compared to forecasts of 3.7%. Inflationary pressure has been increasing for the third month in a row, which, against a strong labor market, where employment growth in March reached 303.0K, and unemployment dropped to 3.8%, significantly reducing the likelihood of a June cut in interest rates by the US Federal Reserve. According to the Chicago Mercantile Exchange (CME) FedWatch Instrument, most market participants expect monetary easing to begin no earlier than September, with some experts suggesting it won’t happen this year. The likelihood of high borrowing costs remaining high for a long time provides significant support for the national currency.
The weakening of the EUR/USD pair may continue today if European Central Bank (ECB) officials during the meeting hint at the possibility of an early transition to the “dovish” rate. According to preliminary estimates, the March consumer price index will decrease from 2.6% to 2.4%, allowing the regulator to adjust monetary policy in June. Previously, the department representatives, including its head, Christine Lagarde, have repeatedly stated this scenario, and if it is confirmed today, the euro will be under pressure.
Support and resistance
The trading instrument is testing 1.0742 (Murrey level [0/8]), and consolidation below will allow the price to fall to the area of 1.0681 (Murrey level [–2/8]) and 1.0645 (38.2% correction). Consolidation above the midline of Bollinger bands (1.0820), which is the key “bullish” level, may lead to growth to 1.0894 (Murrey level [5/8]) and 1.0955 (Murrey level [7/8]).
Technical indicators reflect a continued downward trend in the market: Bollinger Bands and Stochastic are directed downwards, and the MACD histogram is increasing in the negative zone.
Resistance levels: 1.0820, 1.0894, 1.0955.
Support levels: 1.0742, 1.0681, 1.0645.
Trading tips
Short positions may be opened below 1.0742, with the targets at 1.0681, 1.0645, and stop loss 1.0775. Implementation time: 5–7 days.
Long positions may be opened from 1.0820, with the targets at 1.0894, 1.0955, and stop loss 1.0790.
風險提示:本文所述僅代表作者個人觀點,不代表 Followme 的官方立場。Followme 不對內容的準確性、完整性或可靠性作出任何保證,對於基於該內容所採取的任何行為,不承擔任何責任,除非另有書面明確說明。
 暫無留言。 來發表第一則觀點吧。