


| Scenario | |
|---|---|
| Timeframe | Intraday |
| Recommendation | BUY STOP |
| Entry Point | 0.9150 |
| Take Profit | 0.9200 |
| Stop Loss | 0.9120 |
| Key Levels | 0.9037, 0.9071, 0.9100, 0.9130, 0.9150, 0.9175, 0.9200, 0.9225 |
| Alternative scenario | |
|---|---|
| Recommendation | SELL |
| Entry Point | 0.9125 |
| Take Profit | 0.9071 |
| Stop Loss | 0.9160 |
| Key Levels | 0.9037, 0.9071, 0.9100, 0.9130, 0.9150, 0.9175, 0.9200, 0.9225 |
Current trend
During the Asian session, the USD/CHF pair is growing slightly, consolidating near 0.9150 and the highs of October 6, supported by expectations of postponing the US Fed interest rate cut from June to a later date. Against positive macroeconomic statistics and persistent inflation, investors are increasingly counting on the fact that the transition to the “dovish” rate will take place no earlier than the September meeting of the regulator, and some experts admit that it will be postponed until the end of the year.
Today at 14:30 (GMT 2), retail sales data will be published: according to preliminary estimates, the March figure will slow down from 0.6% to 0.3%, and excluding car sales, it will increase from 0.3% to 0.4%. Traders continue to evaluate the producer price index, which accelerated in March from 1.6% to 2.1% YoY and slowed from 0.6% to 0.2% MoM, and the core value excluding the most volatile food products and energy prices adjusted from 2.1% to 2.4% YoY and from 0.3% to 0.2% MoM, respectively, increasing the likelihood of the US Fed maintaining high interest rates.
Swiss investors are awaiting the release of March statistics on the volume of imports and one of the most important inflation indicators, the producer price index. It reflects changes in the cost of goods, components, and raw materials in the wholesale market. In February, the indicator changed by 0.1% MoM and –2.0% YoY.
Support and resistance
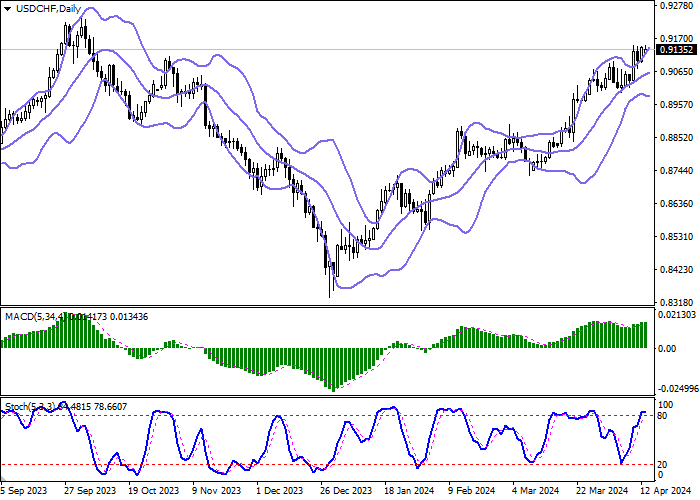
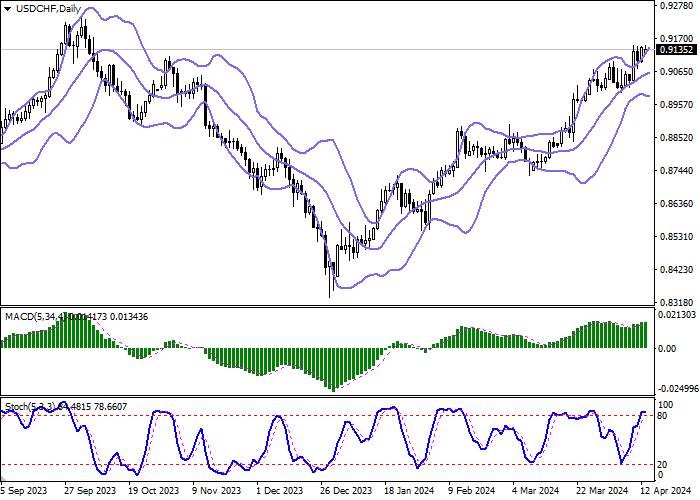
On the daily chart, Bollinger Bands are growing: the price range is expanding from above but not as fast as the “bullish” activity develops. The MACD indicator is rising, keeping a poor buy signal: the histogram is above the signal line. Stochastic approached its highs and reversed horizontally, indicating that the American dollar may become overbought in the ultra-short term.
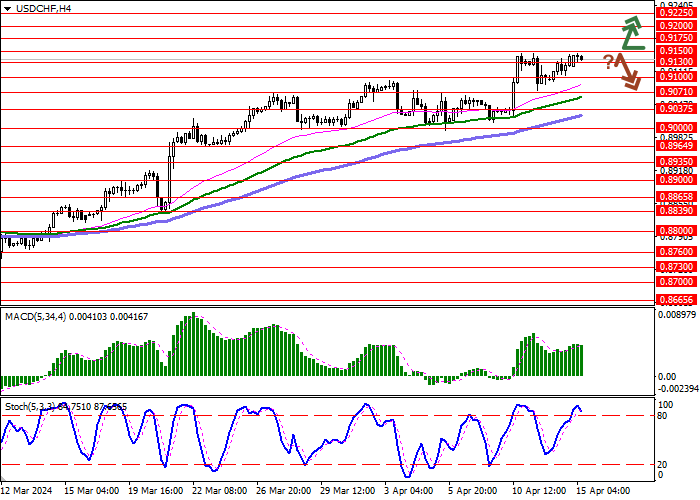
Resistance levels: 0.9150, 0.9175, 0.9200, 0.9225.
Support levels: 0.9130, 0.9100, 0.9071, 0.9037.
Trading tips
Long positions may be opened after a breakout of 0.9150, with the target at 0.9200. Stop loss – 0.9120. Implementation time: 1–2 days.
Short positions may be opened after a rebound from 0.9150 and a breakdown of 0.9130, with the target at 0.9071. Stop loss – 0.9160.
風險提示:本文所述僅代表作者個人觀點,不代表 Followme 的官方立場。Followme 不對內容的準確性、完整性或可靠性作出任何保證,對於基於該內容所採取的任何行為,不承擔任何責任,除非另有書面明確說明。
 暫無留言。 來發表第一則觀點吧。