


| Scenario | |
|---|---|
| Timeframe | Weekly |
| Recommendation | SELL STOP |
| Entry Point | 155.40 |
| Take Profit | 151.00 |
| Stop Loss | 157.00 |
| Key Levels | 151.00, 154.00, 155.00, 157.00, 157.50, 158.10, 162.60, 163.00 |
| Alternative scenario | |
|---|---|
| Recommendation | BUY STOP |
| Entry Point | 158.10 |
| Take Profit | 162.60 |
| Stop Loss | 157.00 |
| Key Levels | 151.00, 154.00, 155.00, 157.00, 157.50, 158.10, 162.60, 163.00 |
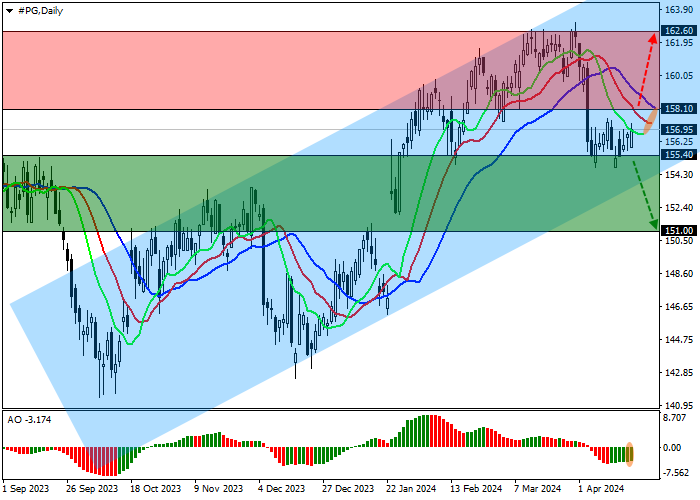
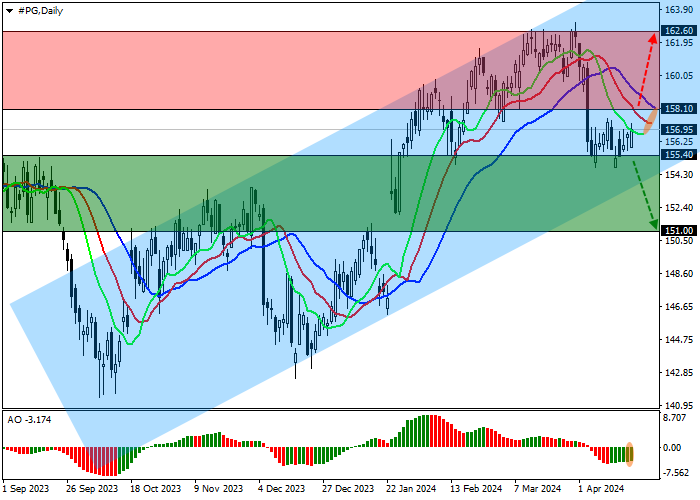
Shares of The Procter & Gamble Co., one of the leaders in the consumer goods market, are trading at 157.00.
On the daily chart, the price is approaching the support line of the ascending corridor with dynamic boundaries of 163.00–154.00.
On the four-hour chart, the corrective wave is developing within the sideways channel 157.50–155.00, preparing to overcome its lower border. Afterward, it may reach 154.00 and then 150.00. Otherwise, a return to the resistance line of 163.00 is possible.
Technical indicators maintain a sell signal: fast EMA on the Alligator indicator are far enough from the signal line, and the AO histogram forms corrective bars in the buy zone.
Trading tips
Short positions may be opened after the price declines and consolidates below 155.40, with the target at 151.00. Stop loss – 157.00. Implementation period: 7 days or more.
Long positions may be opened after the price rises and consolidates above 158.10, with the target at 162.60. Stop loss – 157.00.
風險提示:本文所述僅代表作者個人觀點,不代表 Followme 的官方立場。Followme 不對內容的準確性、完整性或可靠性作出任何保證,對於基於該內容所採取的任何行為,不承擔任何責任,除非另有書面明確說明。
 暫無留言。 來發表第一則觀點吧。