


Pan American Silver (PAAS) is a well-established Canadian silver mining company operating globally. It has assets primarily in the Americas, including Mexico, Peru, Bolivia, and Argentina. Known for its extensive experience and diversified portfolio, PAAS engages in exploration, development, and production of silver, gold, zinc, lead, and copper. Below we will look at the Elliott Wave outlook for the company.
PAAS Monthly Elliott Wave Chart
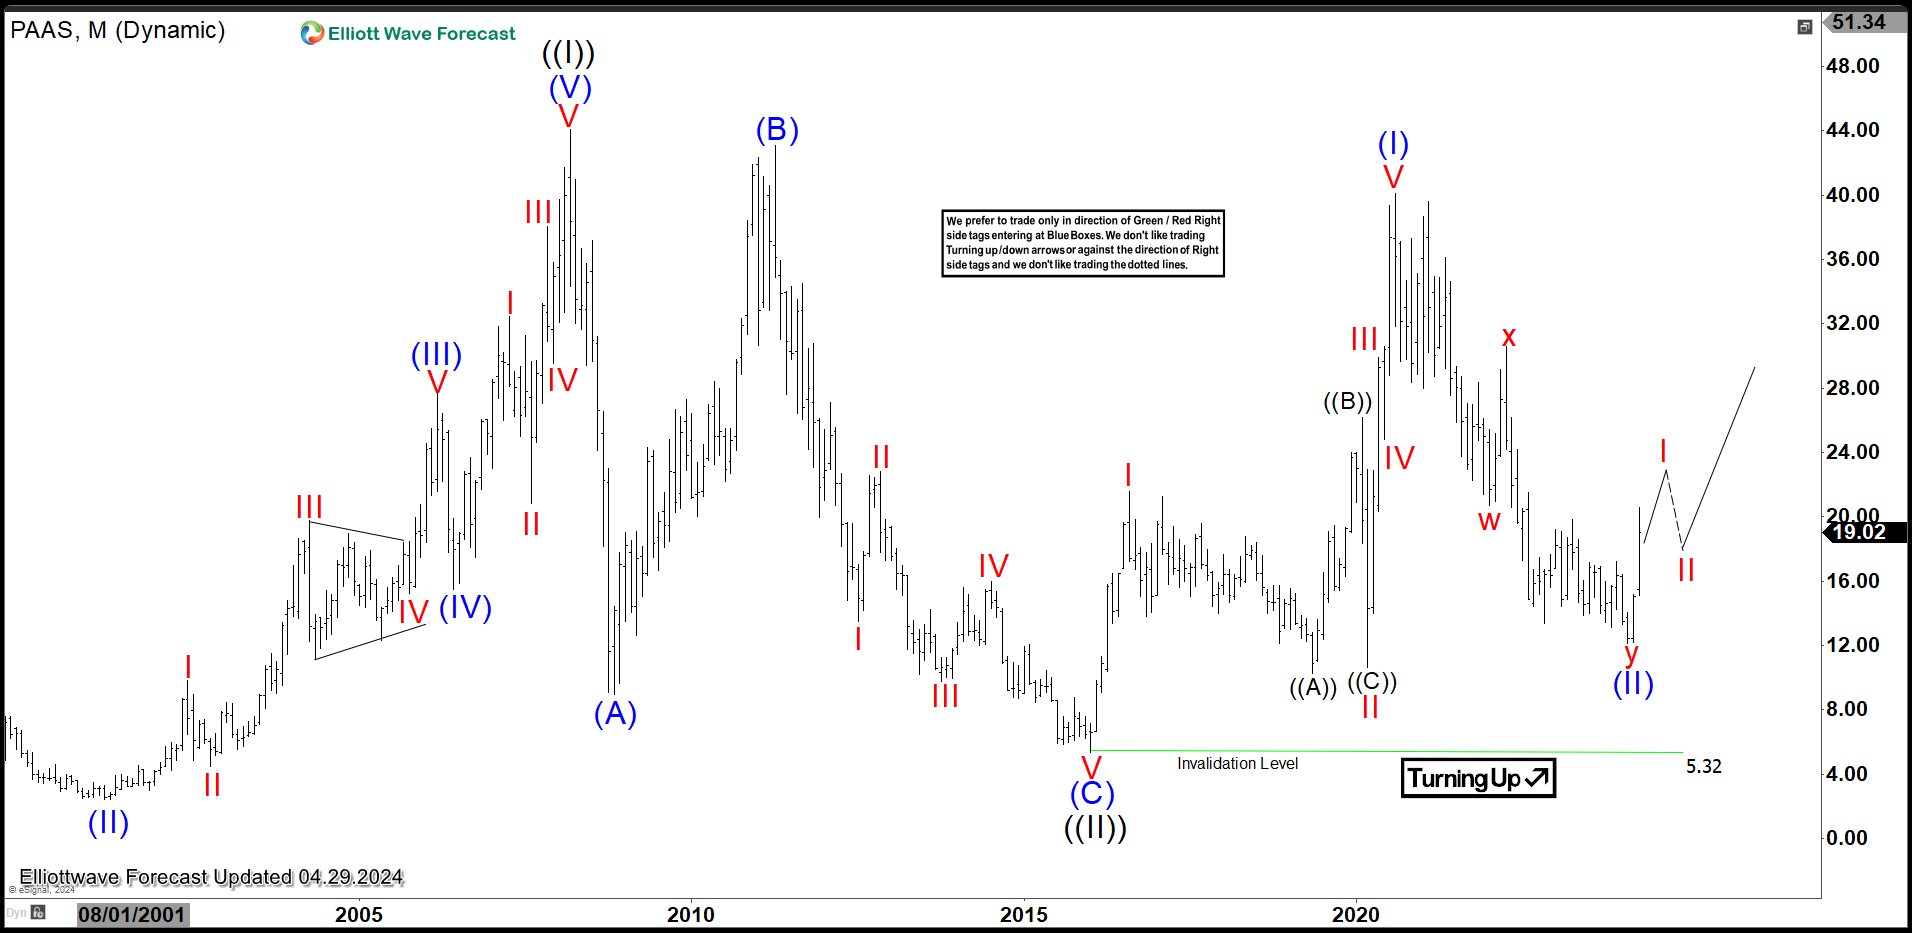
Monthly Elliott Wave chart of Pan American Silver (PAAS) above shows wave ((II)) pullback ended at 5.32 on January 2016 low. The stock then started to turn higher with Wave (I) ended at 40.11. Wave (II) pullback likely has ended at 12.16. The stock has since turned higher in what looks to be an impulsive structure. This suggests the next leg higher has likely started.
PAAS Daily Elliott Wave Chart
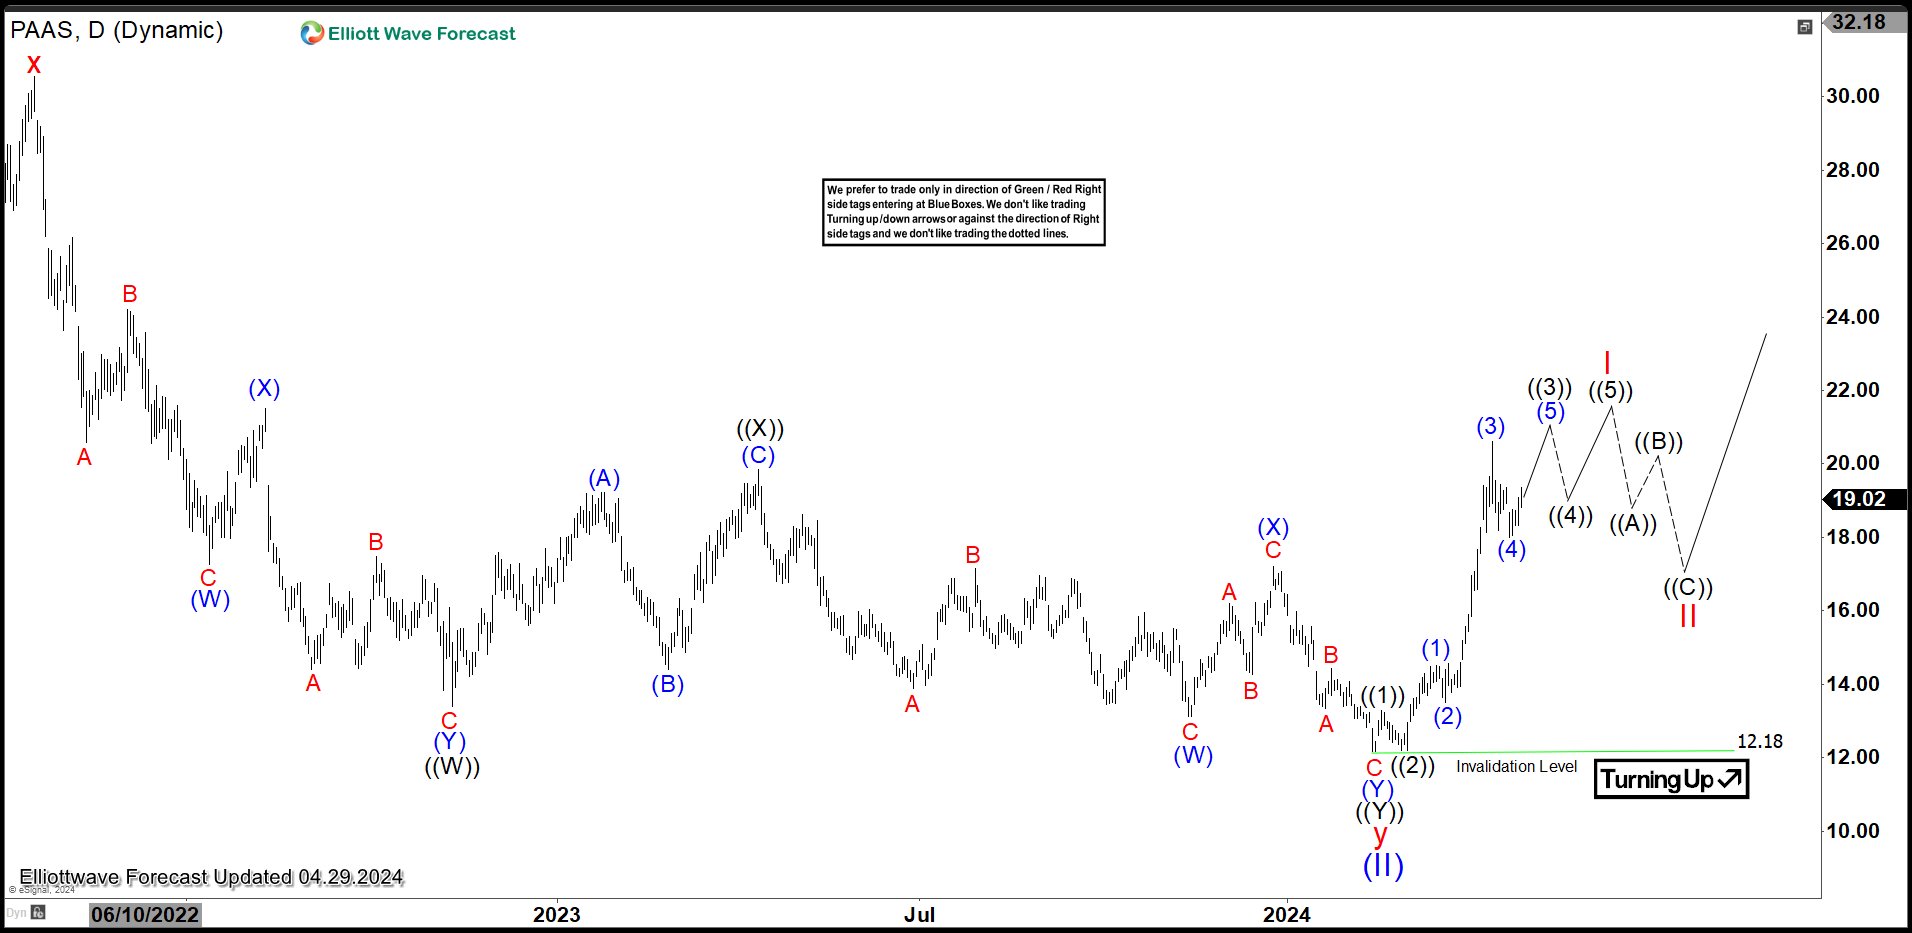
Daily Elliott Wave Chart of Pan American Silver (PAAS) above shows the rally from wave (II) low at 12.18. The structure of the rally impulsive with wave ((1))) ended at 13.28 and wave ((2)) ended at 12.2. The stock then sees further separation in subsequent rally in wave ((3)) with internal subdivision as another impulse in lesser degree. Expect the stock to extend higher 1 more leg to end wave ((3)). Afterwards, it should pullback in wave ((4)) before it resumes higher again in wave ((5)) to complete wave I. The stock should then pullback in wave II to correct cycle from 2.13.2024 low before it resumes higher. Near term, as far as pivot at 12.18 low stays intact, expect the stock to extend higher.
風險提示:本文所述僅代表作者個人觀點,不代表 Followme 的官方立場。Followme 不對內容的準確性、完整性或可靠性作出任何保證,對於基於該內容所採取的任何行為,不承擔任何責任,除非另有書面明確說明。
 暫無留言。 來發表第一則觀點吧。