


Hello fellow traders. In this technical article we’re going to look at the Elliott Wave charts of Oil published in members area of the website. The commodity shows bullish sequences in the cycle from the 67.75 low. Consequently we are favoring the long side and recommending members to keep buying the dips in 3,7,11 swings when get a chance. However, short term cycle from the April 12th peak shows incomplete sequences, suggesting more downside in near term. In further text we’re going to explain the Elliott Wave analysis.
OIL Elliott Wave 1 Hour Chart 03.09.2024
Oil is showing incomplete sequences in the cycle from the April 12th peak. The price structure is calling for more downside as far as 86.3 pivot holds. Current view suggests we are about to complete wave ((x)) connector as Elliott Wave Zig Zag Pattern. We don't recommend selling. Strategy is waiting for extreme zone to be reached before buying the commodity again.
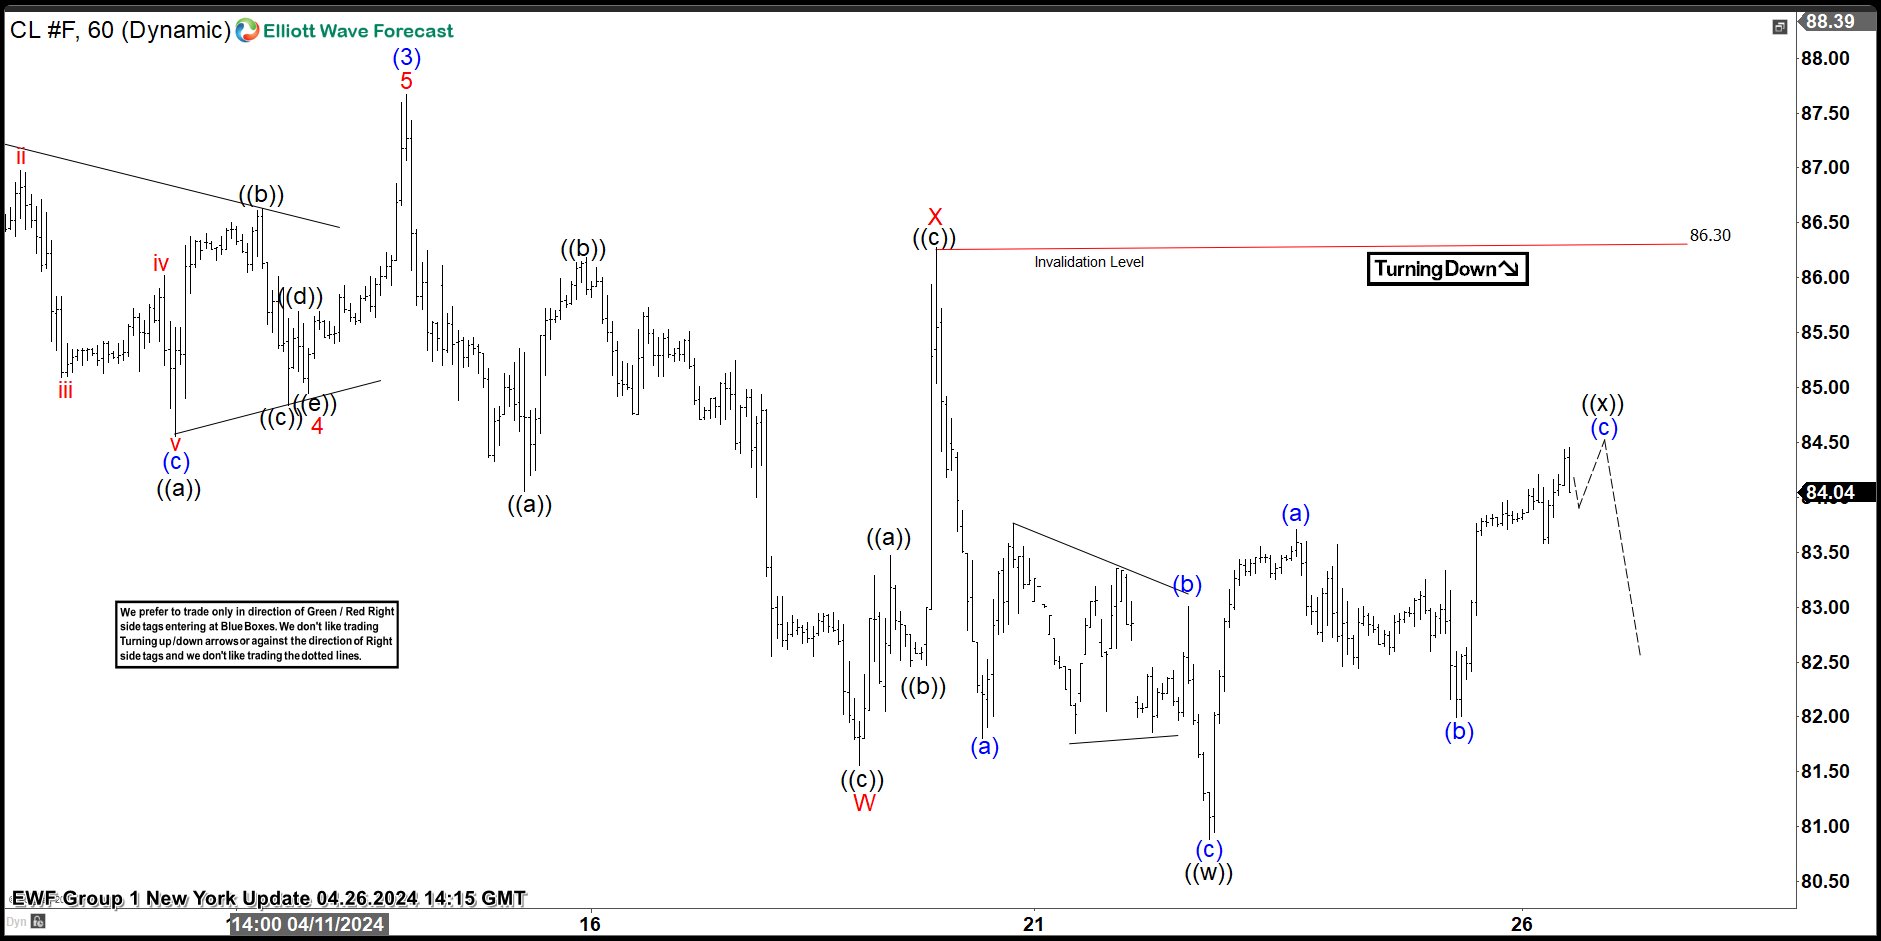
OIL Elliott Wave 1 Hour Chart 03.13.2024
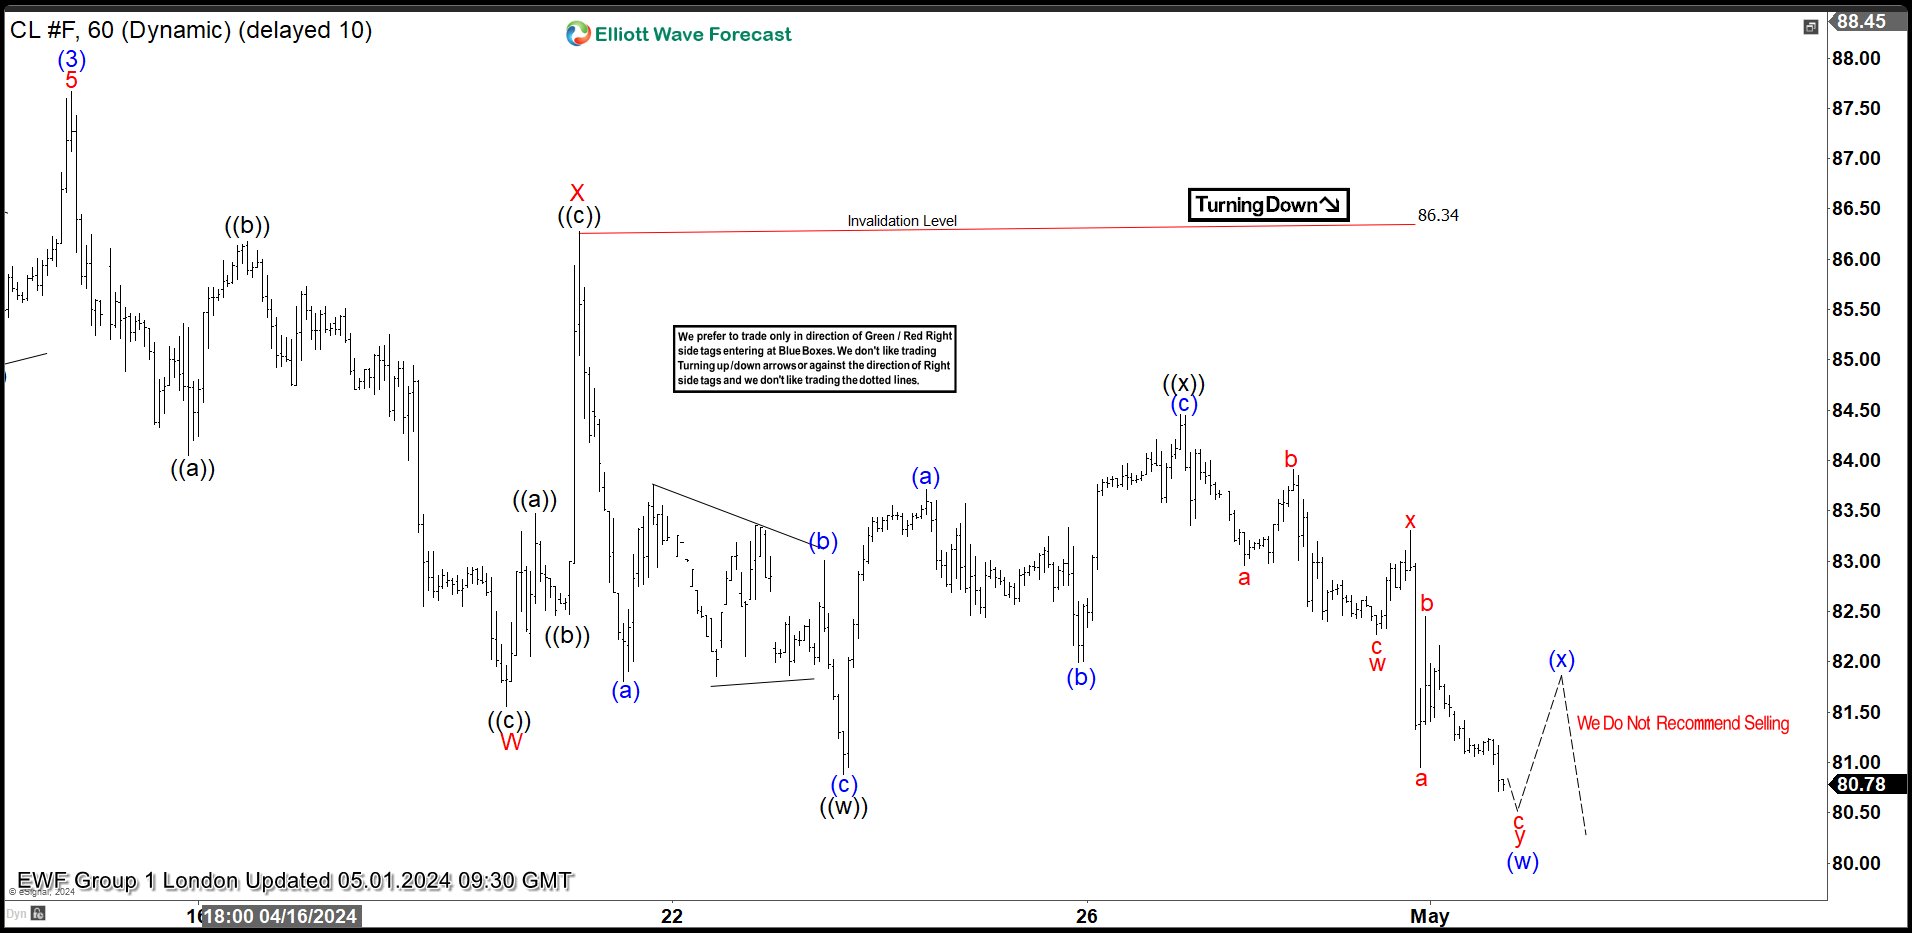
The commodity completed 3 waves correction as ((x)) black, and made decline toward new lows as expected. The price is heading toward our target area 80.19-76.42 where we would like to be buyers again. We don't recommend selling the commodity and prefer the long side from the mentioned extreme zone.
Keep in mind that market is dynamic and presented view could have changed in the mean time. You can check most recent charts with target levels in the membership area of the site. Best instruments to trade are those having incomplete bullish or bearish swings sequences. We put them in Sequence Report and best among them are shown in the Live Trading Room
New to Elliott Wave ? Check out our Free Elliott Wave Educational Web Page and download our Free Elliott Wave Book.
風險提示:本文所述僅代表作者個人觀點,不代表 Followme 的官方立場。Followme 不對內容的準確性、完整性或可靠性作出任何保證,對於基於該內容所採取的任何行為,不承擔任何責任,除非另有書面明確說明。
 暫無留言。 來發表第一則觀點吧。