


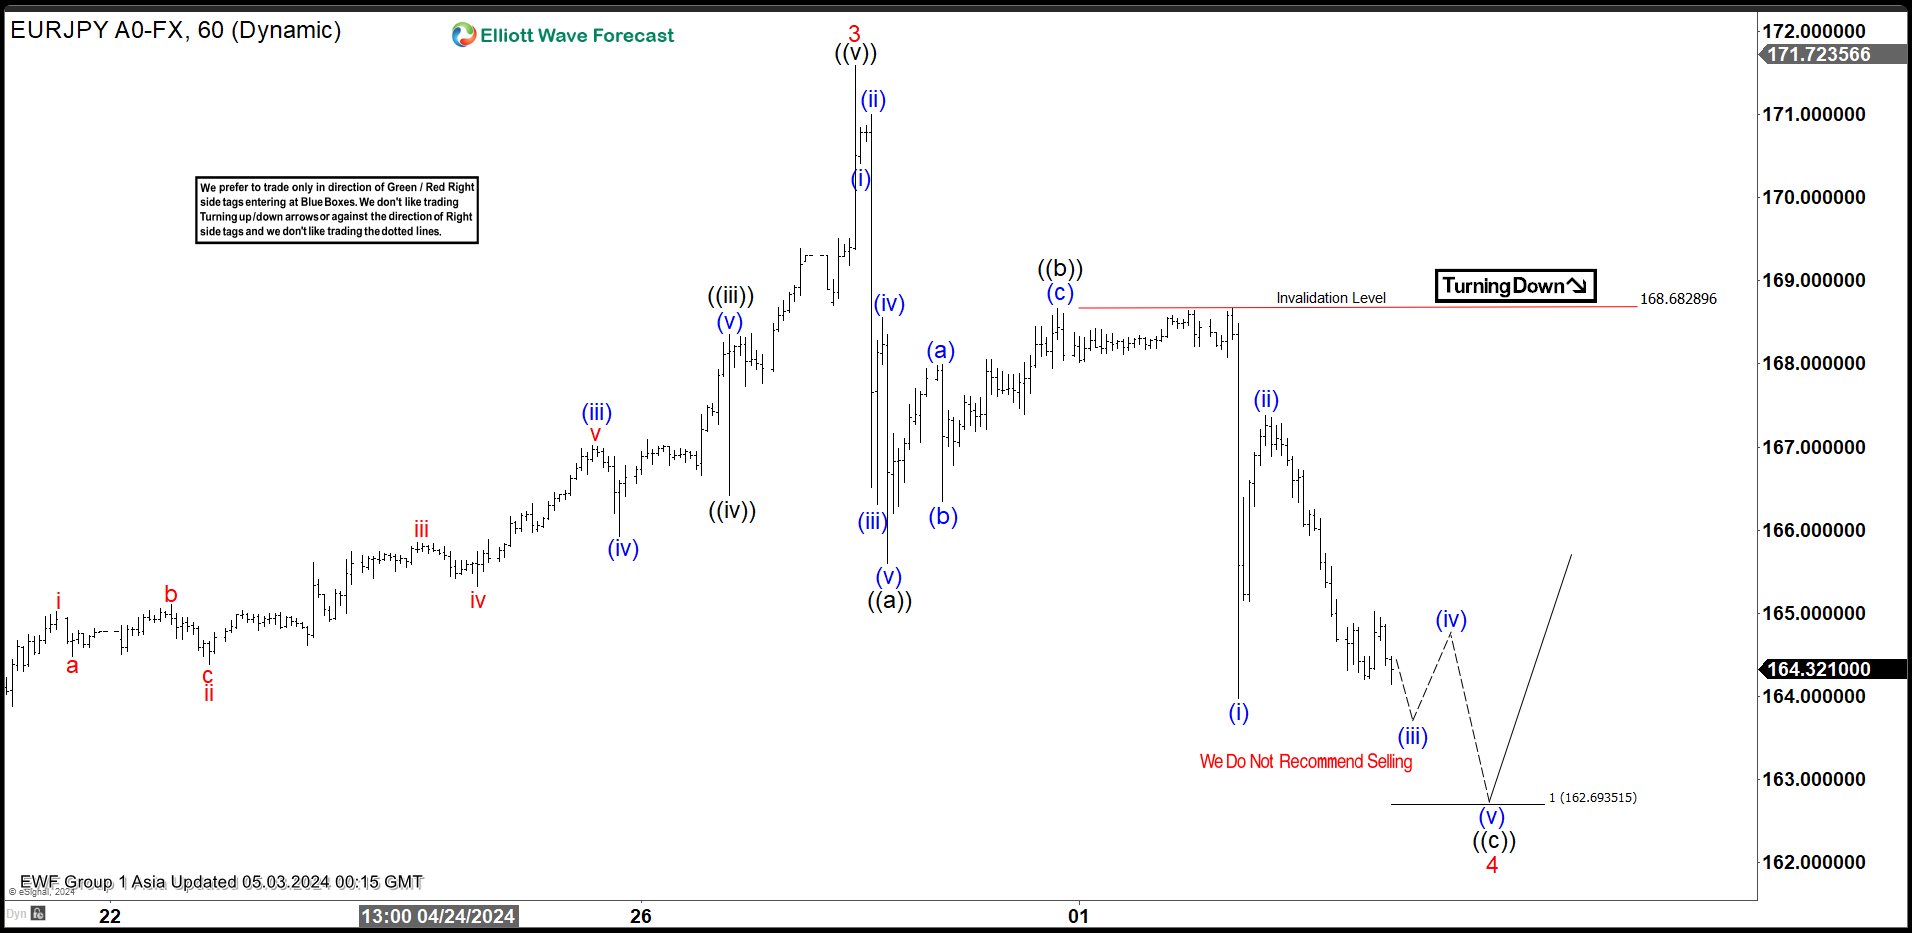
Short Term Elliott Wave View on EURJPY suggests the rally from 12.7.2023 low is in progress as a 5 waves. Up from 12.7.2023 low, wave 1 ended at 163.71 and pullback in wave 2 ended at 160.21. Pair extended higher in wave 3 towards 171.58. The 60 minutes time frame below shows the rally which ended wave 3. Wave 4 pullback is currently in progress with internal subdivision as a zigzag Elliott Wave structure. Down from wave 3, wave (i) ended at 170.41 and rally in wave (ii) rally ended at 171. Pair extended lower in wave (iii) towards 166.31 and rally in wave (iv) ended at 168.55.
Final leg wave (v) lower ended at 165.6 which completed wave ((a)) in higher degree. Pair then bounced in wave ((b)) with internal subdivision as a zigzag in lesser degree. Up from wave ((a)), wave (a) ended at 167.99 and pullback in wave (b) ended at 166.34. Final leg wave (c) higher ended at 168.68 which completed wave ((b)) in higher degree. Pair extended lower in wave ((c)) with internal subdivision as 5 waves. Down from wave ((b)), wave (i) ended at 163.97 and wave (ii) rally ended at 167.38. Near term, as far as pivot at 168.68 high stays intact, expect pair to continue lower. Potential target lower is 100% - 161.8% Fibonacci extension of wave ((a)). This area comes at 159 - 162.7 area where support can be seen.
EURJPY 60 Minutes Elliott Wave Chart
風險提示:本文所述僅代表作者個人觀點,不代表 Followme 的官方立場。Followme 不對內容的準確性、完整性或可靠性作出任何保證,對於基於該內容所採取的任何行為,不承擔任何責任,除非另有書面明確說明。
 暫無留言。 來發表第一則觀點吧。