


In this technical blog, we are going to take a look at the past performance of EURGBP 4-Hour Elliott wave Charts that we presented to our members. In which, the decline to 2/14/2024 low took place as an impulsive structure and showed a lower sequence with a bearish right side tag calling for more downside to happen. Therefore, our members knew that selling the bounces in the direction of the right side tag remained the preferred path. We will explain the Elliott wave structure & selling opportunity our members took below:
EURGBP 4-Hour Elliott Wave Chart From 4.20.2024
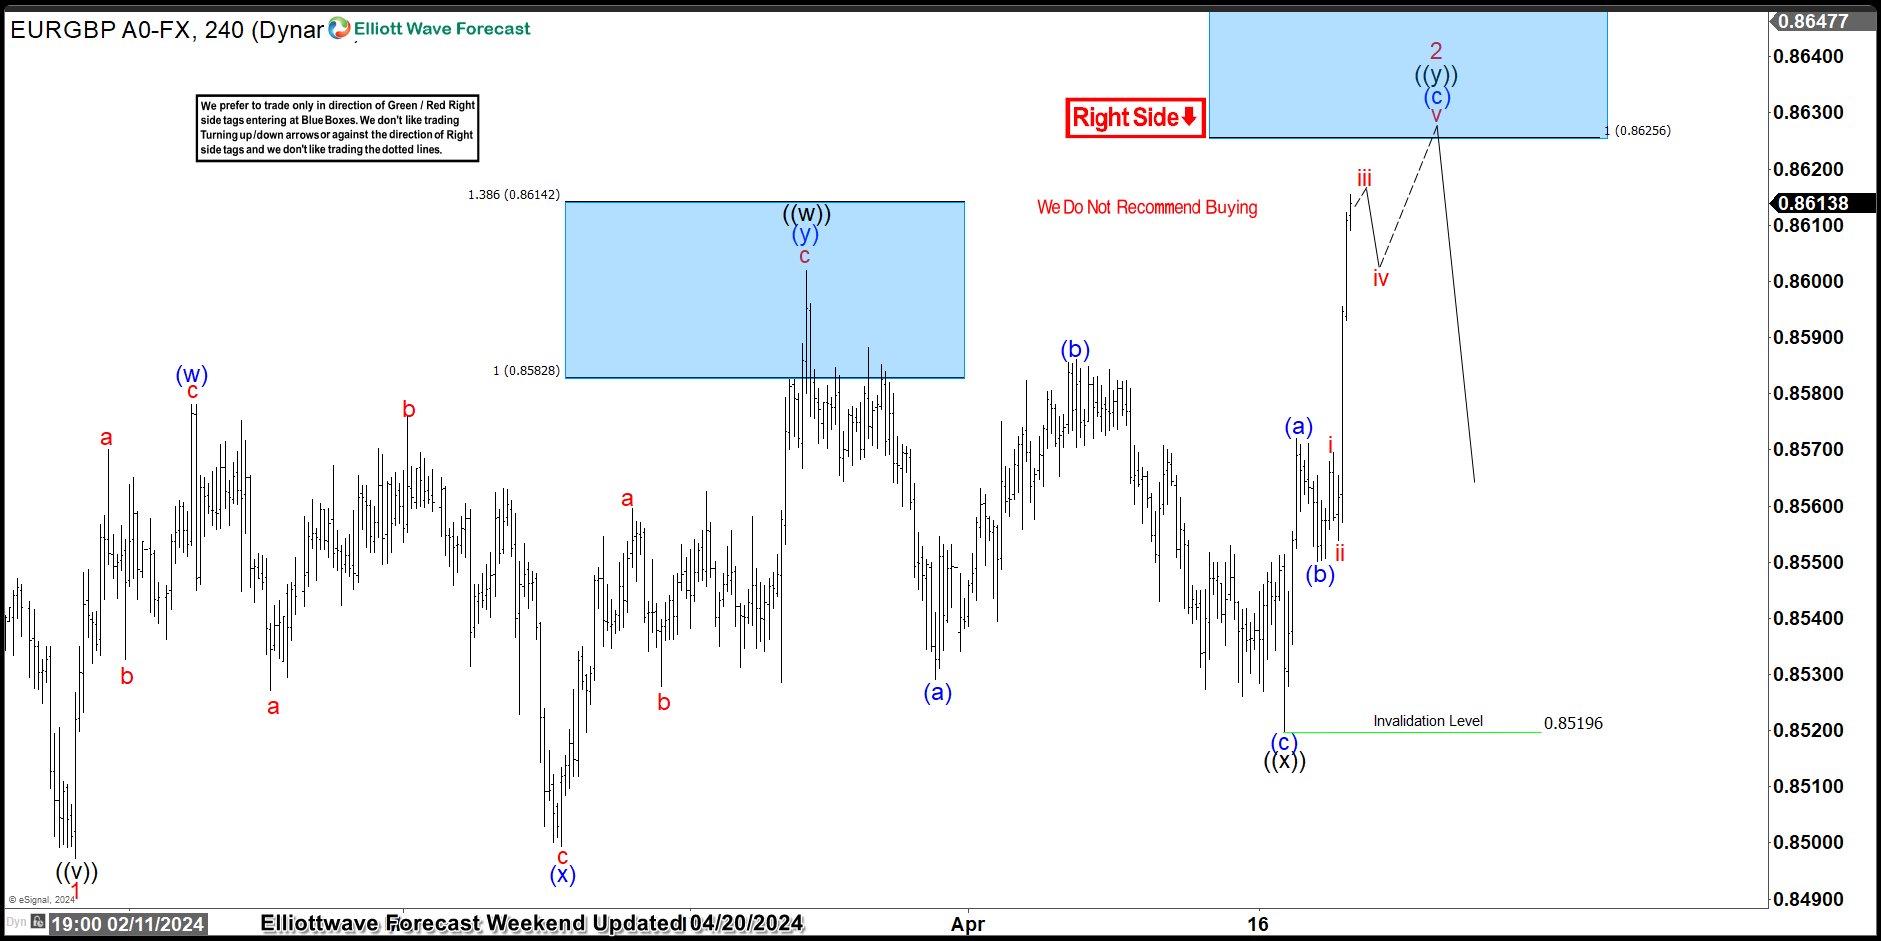
EURGBP 4-Hour Elliott Wave Chart from 4/20/2024 Weekend update. In which the decline to 0.8497 low ended wave 1 as an impulse sequence. Up from there, the pair made a bounce in wave 2. The internals of that bounce unfolded as a double three structure where wave ((w)) ended at 0.8602 high. Wave ((x)) pullback ended at 0.8519 low. And wave ((y)) was expected to reach the blue box area. From there, sellers were expected to appear looking for further downside or a minimum 3-wave reaction lower.
EURGBP Latest 4-Hour Elliott Wave Chart From
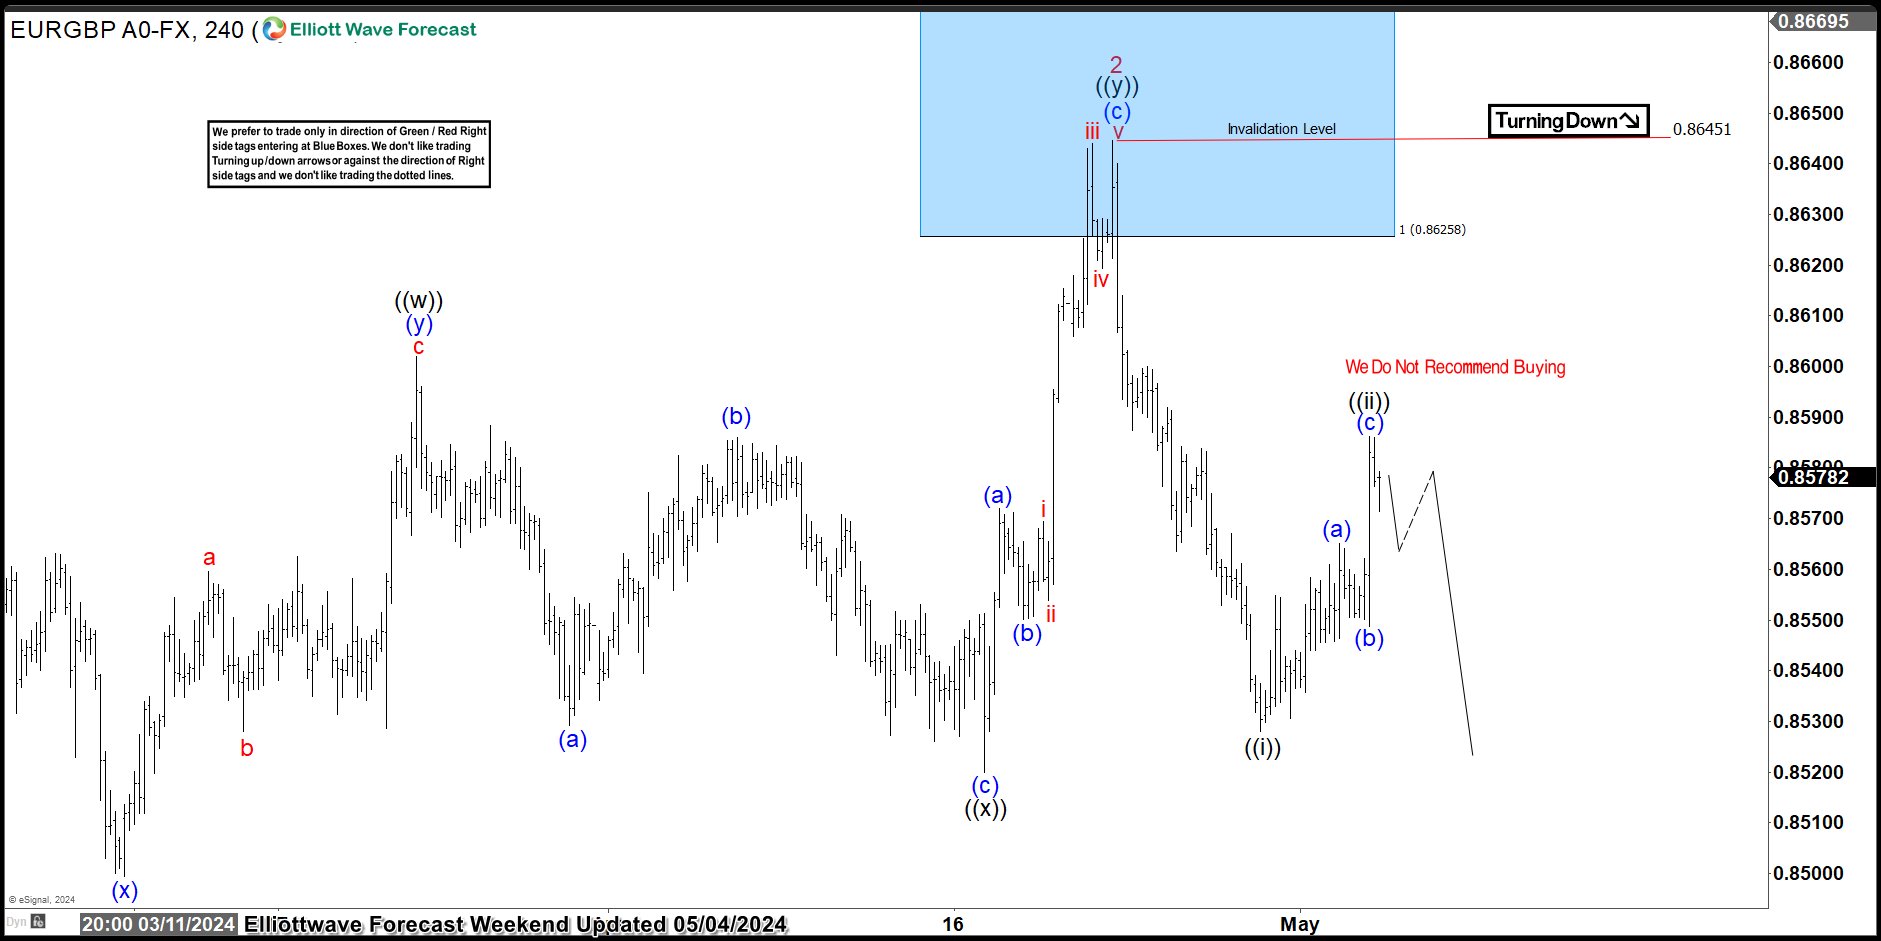
This is the latest 4-Hour view from the 5/04/2024 Weekend update. In which the pair is showing a reaction lower taking place from the blue box area. Allowing shorts to get into a risk-free position shortly after taking the position. But a break below the 0.8497 low remains to be seen to confirm the next extension lower towards the 0.8376- 0.8210 area & avoid double correction higher.
風險提示:本文所述僅代表作者個人觀點,不代表 Followme 的官方立場。Followme 不對內容的準確性、完整性或可靠性作出任何保證,對於基於該內容所採取的任何行為,不承擔任何責任,除非另有書面明確說明。
 暫無留言。 來發表第一則觀點吧。