


| Scenario | |
|---|---|
| Timeframe | Weekly |
| Recommendation | SELL STOP |
| Entry Point | 137.50 |
| Take Profit | 125.00, 112.50, 100.00 |
| Stop Loss | 147.00 |
| Key Levels | 100.00, 112.50, 125.00, 155.70, 175.00, 187.50 |
| Alternative scenario | |
|---|---|
| Recommendation | BUY STOP |
| Entry Point | 155.75 |
| Take Profit | 175.00, 187.50 |
| Stop Loss | 145.00 |
| Key Levels | 100.00, 112.50, 125.00, 155.70, 175.00, 187.50 |
Current trend
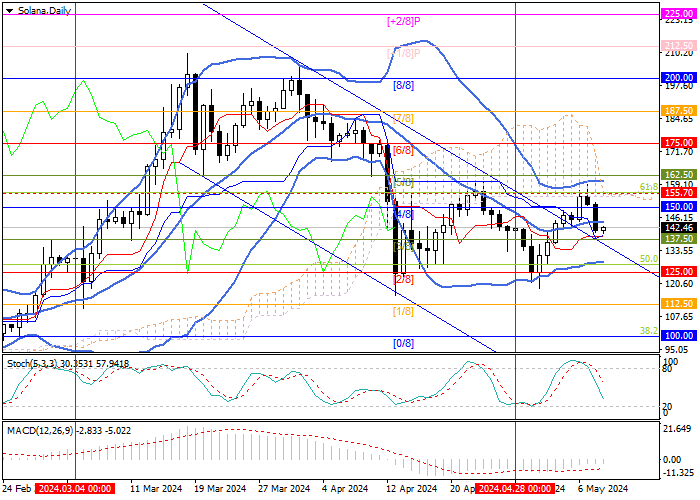
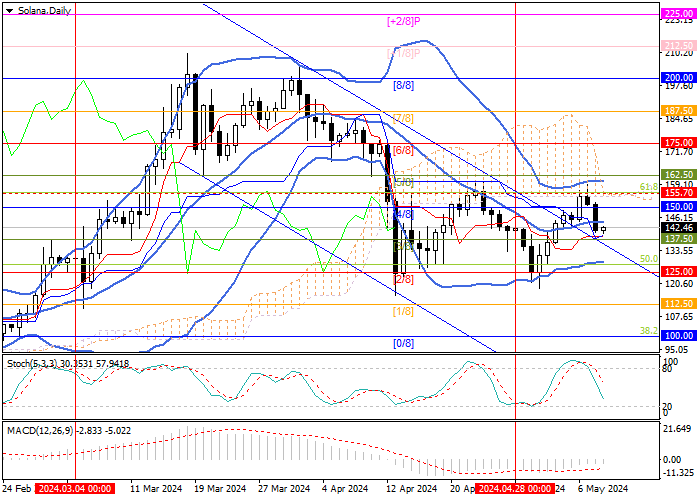
This week, the SOL/USD pair left the medium-term descending channel, breaking through its upper limit, and began forming a new range of 155.70-125.00 (61.8% Fibonacci retracement, Murrey level [2/8]), but currently quotes are adjusting downwards. Pressure on the position of the SOL token was exerted by monetary factors, as well as reports about the bankruptcy procedure of the FTX crypto exchange.
Recall that weak data from the US labor market published on Friday raised investors' hopes for the beginning of monetary policy easing this year, but the subsequent comments from officials disappointed the market again. The members of the regulator maintained a cautious position, confirming that in order to defeat inflation, interest rates must remain high for a long time, and if necessary, they need to be raised again. In turn, statements by the new management of the FTX cryptocurrency platform, who announced the availability of the necessary funds to compensate for customer losses totaling about 11.0 billion dollars, supported investor sentiment. However, to do this, it is necessary to sell most of the available assets, 34.0% of which are SOL tokens. Thus, the prospect of bringing the maximum number of coins to the market soon will continue to put pressure on the SOL/USD pair in the medium term.
Support and resistance
Technically, the price has consolidated below the central line of Bollinger Bands and may continue to decline towards the targets of 125.00 (Murrey level [2/8]), 112.50 (Murrey level [1/8]), 100.00 (Murrey level [0/8], 38.2% Fibonacci retracement). The key for the "bulls" is the level of 155.70 (61.8% Fibonacci retracement), at the breakout of which the upward dynamics will resume towards 175.00 (Murrey level [6/8]) and 187.50 (Murrey level [7/8]).
Technical indicators do not give a clear signal: Bollinger Bands are horizontal, MACD histogram is stable in the negative zone, and Stochastic has reversed down.
Resistance levels: 155.70, 175.00, 187.50.
Support levels: 125.00, 112.50, 100.00.
Trading tips
Short positions should be opened from the 137.50 mark with targets of 125.00, 112.50, 100.00 and stop-loss of 147.00. Implementation period: 5–7 days.
Long positions should be opened above the level of 155.70 with targets of 175.00, 187.50 and stop-loss of 145.00.
風險提示:本文所述僅代表作者個人觀點,不代表 Followme 的官方立場。Followme 不對內容的準確性、完整性或可靠性作出任何保證,對於基於該內容所採取的任何行為,不承擔任何責任,除非另有書面明確說明。
 暫無留言。 來發表第一則觀點吧。